CMS just locked in a 2.48% payment increase – far higher than anyone expected. Here’s what it means for your premiums, your benefits, and your choices this fall.
If you’re one of the more than 35 million Americans enrolled in a Medicare Advantage plan or if you’re about to turn 65 and weighing your options — the 2027 rate announcement from the Centers for Medicare & Medicaid Services is news that directly touches your wallet, your benefits, and your peace of mind.
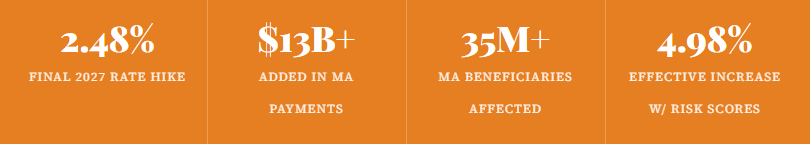
On April 6, 2026, CMS dropped a number that surprised practically everyone: a 2.48% average rate hike for Medicare Advantage (MA) plans in Calendar Year 2027. That’s a 27-fold jump from the measly 0.09% that the agency floated back in January and it translates into more than $13 billion in additional government payments flowing to MA insurers next year. If you had seen health insurer stocks – UnitedHealth and CVS Health each jumped more than 9% in after-hours trading, while Humana surged around 12%, you already sensed the significance.
But what does any of this mean for you, sitting at your kitchen table trying to figure out whether your dental coverage will still be there in 2027? Let’s break it all down plainly, honestly, and without the Washington jargon.
What is the Medicare Advantage Rate Hike for 2027?
Every year, CMS – the federal agency that runs Medicare, sets the payment rates it will use to reimburse private insurance companies for running Medicare Advantage plans. Think of it as the government’s annual check to companies like Humana, UnitedHealthcare, Aetna, and CVS Health in exchange for providing Medicare coverage to their enrollees.
The 2027 final rate announcement, officially released on April 6, 2026, finalizes a net average payment increase of 2.48% or more than $13 billion above what the government was paying plans in 2026. When you factor in the estimated trend in MA risk scores (driven by population changes and coding practices), the effective increase reaches a full 4.98%.
From Panic to Relief: How the Final Number Jumped So Much
The story of the 2027 rate is really the story of two very different numbers. In January 2026, CMS published its Advance Notice proposing just a 0.09% increase — barely above zero. Industry analysts described it as a near-catastrophe. Insurance companies warned they’d have to slash benefits, hike premiums, or exit entire markets. The Better Medicare Alliance, a major advocacy organization, mobilized thousands of beneficiaries to flood CMS with public comments.
By the time the final number landed in April, the story had flipped. CMS walked back its proposed risk adjustment model recalibration — the single biggest driver of the original low figure and incorporated updated Medicare claims data through Q4 2025. The result: a 2.48% final increase that Wall Street cheered and patient advocates quietly welcomed, even if the insurance industry had hoped for closer to 3–5%.
Breaking Down the 2027 Medicare Advantage Payment Changes
The final rate announcement is more than just one headline number. It’s a collection of interlocking policy decisions, each of which shapes how much money flows to plans and ultimately to beneficiaries. Here’s what’s actually inside the 2027 announcement.
1. The Effective Growth Rate
This is the backbone of the rate increase. The Effective Growth Rate reflects projected growth in Medicare Advantage benchmarks, largely driven by growth in Original (Traditional) Medicare per capita costs as estimated by CMS’s Office of the Actuary. The incorporation of updated program experience data including original Medicare claims through Q4 2025 – significantly lifted the growth rate from what was initially proposed in January.
2. The Risk Adjustment Model: A Major Reversal
This was the most controversial element of the 2027 cycle. In January, CMS had proposed updating the risk adjustment model with far more recent data — shifting from calibration based on 2018 diagnoses and 2019 expenditures to 2023 diagnoses and 2024 expenditures. Insurers argued this would dramatically reduce their payments and they hadn’t had enough time to absorb the Biden-era V28 model changes that were just fully phased in.
CMS listened. For 2027, the agency will continue using the 2024 MA risk adjustment model calibrated with the older data, giving the market more time to adjust. Industry analysts called the reversal “hard to overstate” as a victory for the MA sector.
3. Excluding Diagnoses From Unlinked Chart Review Records
Not everything went the industry’s way. CMS did finalize a meaningful anti-upcoding measure: starting in 2027, diagnoses from unlinked Chart Review Records (CRRs) – records not tied to an actual patient encounter will no longer count toward risk scores. There is one exception: beneficiaries switching from one MA organization to another.
This matters because upcoding where insurers submit diagnoses that make patients appear sicker than they are to collect higher risk-adjusted payments has been estimated to cost taxpayers tens of billions of dollars annually. The Medicare Payment Advisory Commission (MedPAC) recently found that MA costs the government $76 billion more per year in 2026 compared to a scenario where all beneficiaries were in Traditional Medicare.
4. Star Ratings and Quality Bonus Payments
The 2027 payment rates incorporate 2026 Star Ratings for quality bonus payments. Plans that earn four or more stars receive meaningful payment bonuses — which in turn often fund the richer benefits (like dental, vision, and fitness) that attract enrollees to MA in the first place. CMS also finalized a major Star Ratings overhaul in early April 2026, which is expected to send billions of additional dollars to higher-performing plans over the next decade.
5. Part D Risk Adjustment Updates
The 2027 announcement also covers Medicare Part D — prescription drug coverage. CMS finalized updates to the Part D risk adjustment model that account for changes under the Inflation Reduction Act, reflect more current costs, and separately account for MA-PD (prescription drug plans bundled with MA) and standalone PDP costs. These changes are designed to bring greater stability to drug benefits for all Medicare beneficiaries.
Payment Component
Proposed (Jan 2026)
Final (Apr 2026)
Direction
Net Average Payment Increase
0.09% (~$700M)
2.48% (~$13B+)
Significantly Higher
Effective Increase (incl. risk scores)
2.54%
4.98%
Higher
Risk Adjustment Model Recalibration
Proposed (2023 data)
Withdrawn (2018 data retained)
Favorable for Plans
Unlinked CRR Diagnoses Excluded
Proposed
Finalized (with exception)
Anti-upcoding measure
Part D Risk Adjustment Update
Proposed
Finalized
More accurate drug pricing
What Does the 2027 Rate Hike Mean for Medicare Beneficiaries?
Here’s where it gets personal. The rate hike affects insurers directly but its ripple effects reach every person holding a Medicare Advantage card. Here’s what you should actually be thinking about.
Will My Premiums Go Up or Down in 2027?
The short answer: the 2.48% increase is a positive signal for premium stability, but it doesn’t guarantee your specific plan’s premiums won’t rise. Government payment rates are one input into what insurers charge – medical utilization trends, local market competition, and plan-specific Star Ratings all matter too.
Before the final rate was announced, AHIP (the major health insurer trade group) commissioned a study projecting that if the nearly flat 0.09% rate had been finalized, the typical senior couple would face a premium increase of $23/month – over $550/year. That worst-case scenario is now off the table. But industry groups note that 2.48% still doesn’t fully keep pace with the actual cost pressures facing insurers and the physicians they contract with.
What About My Extra Benefits – Dental, Vision, Hearing?
This is the question most beneficiaries care about most. Over the past two years, many MA enrollees experienced benefit cuts in dental, vision, over-the-counter allowances, and fitness programs as insurers trimmed costs in response to elevated medical utilization after the pandemic. The 2.48% final rate takes some pressure off but it does not guarantee a return to the richer benefit packages of 2022 and 2023.
Analysts at Mizuho noted that the boost may help companies expand margins in 2027 — if they keep reducing benefits and managing expenses. In other words, the extra money could go to shareholder returns as easily as it goes back to your dental plan. Watch your Annual Notice of Change carefully when it arrives in the fall.
Action Step for Beneficiaries:
Every year, MA plans must mail you an Annual Notice of Change (ANOC) by September 30. This document will spell out exactly what’s changing in your plan for 2027 – premiums, copays, deductibles, and covered benefits. Read it. Don’t file it away. The Annual Enrollment Period (AEP) runs October 15 – December 7, giving you the window to switch plans if yours is cutting benefits.
Will My Plan Still Be Available in 2027?
Plan exits were a major concern heading into the 2027 cycle. Most major insurers trimmed their MA membership going into 2026, sacrificing growth for profitability. CMS officials acknowledged they weighed the risk of coverage disruptions for seniors – especially with November 2026 midterm elections approaching – when setting the final rate. The more generous 2.48% figure is intended, in part, to reduce the incentive for plans to exit underperforming markets.
Rural Beneficiaries: Still at Greater Risk
Under the original 0.09% proposal, AHIP research found that approximately 70% of MA beneficiaries lived in counties projected to experience payment cuts, with rural communities facing the steepest reductions. The final 2.48% rate relieves much of that pressure but rural access remains a structural challenge, with fewer competing plans and thinner provider networks already in place.
The Bigger Picture: Is Medicare Advantage Still Worth It in 2027?
Medicare Advantage covers more than half of all Medicare beneficiaries – a landmark crossed in 2025. The program’s appeal has always been the combination of lower monthly premiums and extra benefits not available in Original Medicare. But the program has faced mounting scrutiny over the past few years, driven by three overlapping concerns.
The Overpayment Problem
MedPAC’s finding that MA costs the government $76 billion more per year than Traditional Medicare — largely due to coding practices — is not a partisan talking point. It’s a bipartisan fiscal concern that both CMS administrators under both parties have tried, with varying success, to address. The exclusion of unlinked Chart Review Records in 2027 is a step in the right direction, but critics argue the structural incentives to upcode haven’t been eliminated.
The Benefit Volatility Problem
The past two enrollment cycles exposed a growing vulnerability in MA: supplemental benefits (dental, vision, OTC allowances) can disappear year to year. Unlike Original Medicare, where covered benefits are set by federal law and don’t change annually, MA benefits are determined by what plans choose to offer — and what the government payment rate will sustain. This volatility has prompted some seniors to reconsider whether the extra benefits are worth the uncertainty.
The Access Problem
Prior authorization requirements, narrow networks, and treatment denials have drawn congressional scrutiny. CMS’s 2027 reforms include a new special enrollment period trigger: beneficiaries will be able to switch plans outside of open enrollment when their provider exits an MA network — even without CMS having to determine whether the departure was “significant.” That’s a small but meaningful improvement in consumer protections.
Original Medicare vs. Medicare Advantage: A Quick Comparison for 2027
Original Medicare (Parts A & B): Federal program with set benefits, freedom to see any Medicare-accepting provider nationwide, no annual cap on out-of-pocket costs without a Medigap supplement, predictable year-to-year coverage.
Medicare Advantage (Part C): Private plans covering A, B, and usually D; often lower premiums; extra benefits like dental, vision, and hearing; but network restrictions, prior authorization requirements, and year-to-year benefit variability.
Bottom line: There’s no universal answer. It depends on your health status, your doctors, your finances, and your tolerance for plan changes. The 2027 rate hike slightly tilts the MA calculus in a more favorable direction but the structural trade-offs remain.
How the 2027 Rate Compares to Recent Years
Plan Year
Proposed Rate
Final Rate
Additional Payments
2025
~3.7%
~3.7%
~$16B
2026
2.2%
5.06%
~$25B
2027
0.09%
2.48%
$13B+
The pattern of CMS proposing a low number and then finalizing a much higher one is becoming notable. For 2026, the gap between proposal and final was nearly 3 percentage points. For 2027, it was even wider in relative terms – from a near-zero proposal to a 2.48% final rate.
5 Smart Steps Every Medicare Beneficiary Should Take Before 2027
Read your Annual Notice of Change (ANOC) in September 2026. This is the document that tells you exactly what your plan is changing. Don’t let it sit unopened on a table.
Log on to Medicare.gov’s Plan Finder during the Annual Enrollment Period (Oct. 15 – Dec. 7, 2026). Compare your current plan to alternatives in your ZIP code. Drug formularies, network doctors, and out-of-pocket maximums can vary significantly even within the same insurer family.
Check your plan’s Star Rating. Higher-rated plans (4–5 stars) tend to be more financially stable, have better member satisfaction, and often provide richer benefits. CMS publishes Star Ratings each fall at medicare.gov.
If you have a specialist you can’t afford to lose, verify they’re in-network — every year. Provider networks can change annually. Don’t assume your cardiologist or oncologist will still be in your plan’s network just because they were last year.
Talk to a licensed Medicare counselor (SHIP). Every state has a free State Health Insurance Assistance Program (SHIP) that offers one-on-one, unbiased Medicare counseling. They can help you compare plans without trying to sell you anything.
Don’t Wait Until Open Enrollment to Get Informed
The 2027 Medicare Advantage rate announcement is decided but how it affects your specific plan, your premiums, and your benefits won’t be clear until fall 2026. Start preparing now so you can make a confident choice during the Annual Enrollment Period. Compare Plans at Medicare.gov.
Frequently Asked Questions
1. What is the Medicare Advantage rate hike for 2027?
CMS finalized a net average payment increase of 2.48% for Medicare Advantage plans in Calendar Year 2027, announced on April 6, 2026. This adds more than $13 billion in government payments to MA plans compared to 2026. When accounting for estimated risk score trends due to population changes and coding practices, the effective increase reaches 4.98%.
2. Will Medicare Advantage premiums go up in 2027?
The higher-than-proposed final rate reduces upward pressure on premiums. However, individual plan premiums depend on many factors beyond the government payment rate — including local medical costs, the plan’s Star Rating, competition in your market, and insurer decisions about benefit design. Your specific premium changes will be announced in your Annual Notice of Change, which plans must send by September 30, 2026.
3. When will 2027 Medicare Advantage plan details be available?
MA plans submit their 2027 benefit designs to CMS over the summer of 2026. Official plan details become publicly available when the Annual Enrollment Period opens on October 15, 2026. You can compare plans at Medicare.gov’s Plan Finder. Plans must also mail you an Annual Notice of Change by September 30, 2026.
Think about the last time you walked into a hospital and had to fill out the same paper form you filled out three years ago – name, insurance, allergies, medications. Every. Single. Time. Frustrating, right? Now imagine that same hospital losing critical lab results in a fax machine pile-up, or a physician making a prescribing decision without access to a patient’s full medication history because the records are locked in a different EHR system.
This isn’t a hypothetical. This is the daily operational reality for millions of American patients and tens of thousands of U.S. healthcare providers and it’s costing lives, dollars, and trust.
Digital transformation in healthcare is the industry’s answer to these challenges. It’s not simply about buying new software or digitizing old paperwork. It’s a fundamental reimagining of how healthcare is delivered, managed, financed, and experienced – powered by technology, data, and a relentless focus on patient outcomes.
According to a 2024 report by McKinsey & Company, the U.S. healthcare system could unlock up to $1 trillion in annual value through digital health innovation alone. Meanwhile, the global healthcare IT market is projected to surpass $974 billion by 2027, growing at a CAGR of 15.8%, according to Grand View Research.
Whether you’re a hospital CEO navigating post-pandemic budget pressures, a CIO evaluating your next EHR migration, or a health system CMO trying to reduce physician burnout — this guide is for you. Let’s break down what digital transformation in healthcare really means, what’s driving it, and how your organization can lead the charge.
$974B Global Healthcare IT Market by 2027
15.8% Projected CAGR of Healthcare IT
$1T+ Potential Annual Value from Digital Health
What is Digital Transformation in Healthcare?
Digital transformation in healthcare refers to the integration of digital technologies across all aspects of healthcare delivery – from clinical operations and patient engagement to administrative workflows, data analytics, and financial management.
Unlike traditional IT upgrades (swapping one software for another), true digital transformation represents a cultural and organizational shift. It changes how health systems think, operate, and compete in an increasingly value-based care environment.
The Four Pillars of Healthcare Digital Transformation
Digitization: Converting analog processes (paper records, manual workflows) into digital formats.
Digitalization: Using digital data to improve and streamline existing processes.
Digital Transformation: Fundamentally rethinking care delivery models through technology and innovation.
Digital Health Ecosystem: Building interconnected platforms that unify patients, providers, payers, and life sciences.
💡 Key Insight: A 2024 Deloitte survey found that 92% of U.S. health system executives now rank digital transformation as a top-three strategic priority – up from just 58% in 2019. The pandemic didn’t just accelerate digital adoption; it made it non-negotiable.
Key Drivers of Digital Transformation in U.S. Healthcare
Understanding why digital transformation is accelerating helps health leaders prioritize the right investments. Here are the most powerful forces reshaping the landscape:
1. The Shift to Value-Based Care
The Centers for Medicare & Medicaid Services (CMS) is aggressively pushing healthcare toward value-based payment models. By 2025, CMS aims to have 100% of Medicare beneficiaries in accountable care relationships. This shift demands data-driven decision-making at scale — something only digital infrastructure can reliably deliver.
2. Consumer Expectations Have Changed Permanently
Patients today expect the same seamless digital experience from their hospital that they get from Amazon, Netflix, or their bank. A 2024 Accenture study found that 71% of patients would switch providers for a better digital experience. Same-day appointments, real-time test results, telehealth access, and personalized care plans are no longer “nice-to-haves” — they’re table stakes.
3. The Interoperability Mandate
The 21st Century Cures Act and CMS interoperability rules now require health systems to enable open data exchange through FHIR APIs. Failure to comply means financial penalties and reputational damage. Forward-looking organizations are treating this mandate as an opportunity, not a burden.
4. AI and Generative AI Entering the Clinical Mainstream
Artificial intelligence is no longer experimental in healthcare. From AI-assisted radiology reads (FDA has cleared over 700 AI/ML-based medical devices) to ambient clinical documentation tools like Nuance DAX and Microsoft Azure Health Bot, AI is actively reducing physician burden and improving diagnostic accuracy.
5. Workforce Burnout and the Staffing Crisis
The U.S. faces a projected shortage of 124,000 physicians by 2034 (AAMC, 2024), alongside a critical nursing shortage. Digital tools — from automated prior authorization to AI-powered scheduling — are essential workforce multipliers, enabling existing staff to do more with less administrative overhead.
6. Cybersecurity Threats Are Escalating
Healthcare remains the most targeted sector for cyberattacks. The average cost of a healthcare data breach hit $10.9 million in 2023, per IBM’s Cost of a Data Breach Report — the highest of any industry for 13 consecutive years. Digital transformation must include robust cybersecurity infrastructure, not as an afterthought but as a core design principle.
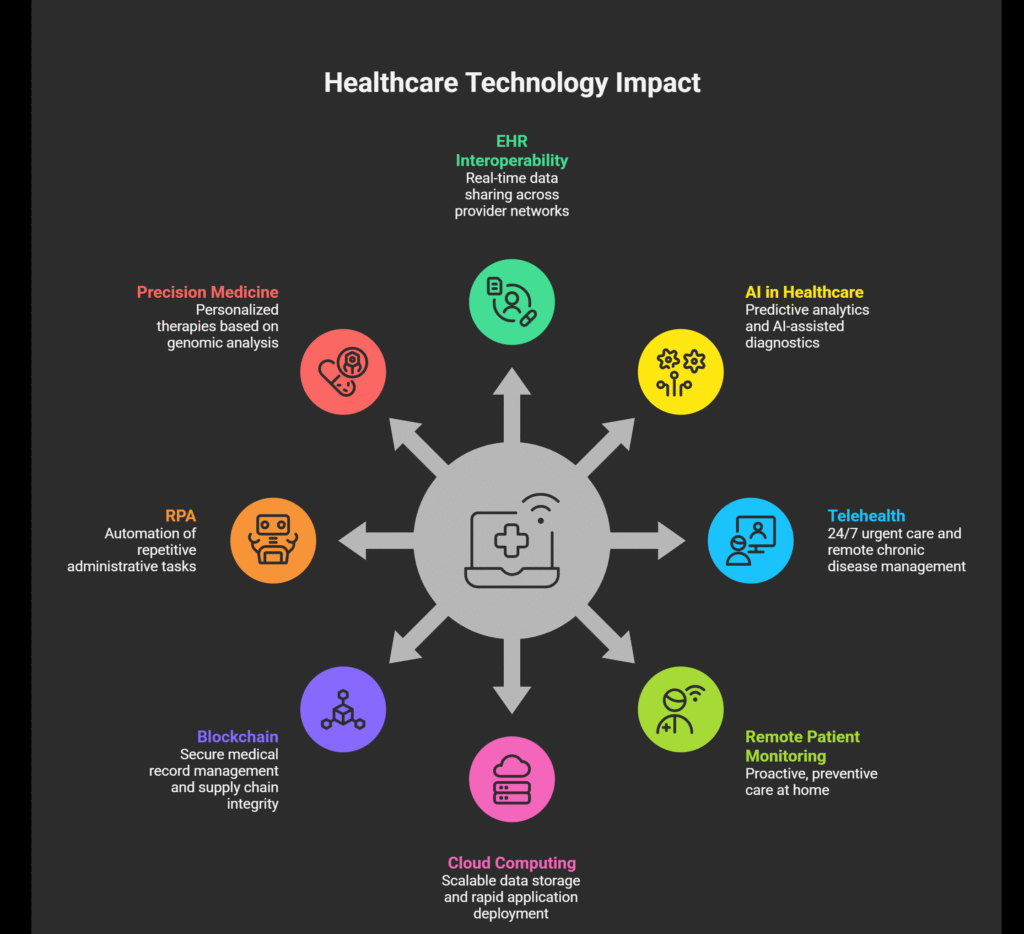
The 8 Technologies Reshaping U.S. Healthcare
Let’s get specific. Here are the core technologies driving healthcare’s digital revolution in 2025 — and the real-world impact they’re delivering:
1. Electronic Health Records (EHR) and Interoperability Platforms
EHRs remain the backbone of healthcare digitization, with over 96% of U.S. hospitals now using certified EHR systems. However, the frontier has moved from simple digitization to intelligent, interoperable platforms. Next-generation EHRs powered by FHIR R4 APIs enable real-time data sharing across provider networks, payer systems, and patient-facing apps.
Epic and Oracle Health (Cerner) dominate the large health system market.
MEDITECH Expanse leads in community hospitals.
Athenahealth and Modernizing Medicine serve ambulatory and specialty practices.
2. Artificial Intelligence & Machine Learning
AI in healthcare is delivering measurable ROI. Key applications include:
Predictive Analytics: Identifying high-risk patients before costly hospitalizations (reducing readmissions by up to 20%).
AI-Assisted Diagnostics: Radiology AI tools like Aidoc and Qure.ai reducing turnaround times by 30–50%.
Clinical Decision Support: Real-time alerts and treatment recommendations at the point of care.
Telehealth visits surged 5,800% during COVID-19 and have stabilized at roughly 17% of all outpatient visits (McKinsey, 2024). Hybrid care models — combining in-person and virtual touchpoints — are becoming the standard of care delivery. Platforms like Teladoc Health, Amwell, and health system-native virtual care solutions are enabling:
24/7 on-demand urgent care access
Chronic disease management via remote patient monitoring
Behavioral health and psychiatry access in underserved communities
4. Remote Patient Monitoring (RPM) and IoT
The Internet of Medical Things (IoMT) market is projected to reach $176 billion by 2026. Wearable biosensors, smart infusion pumps, continuous glucose monitors (CGMs), and connected cardiac devices are generating a continuous stream of patient data — enabling proactive, preventive care at home rather than reactive care in expensive acute settings.
5. Cloud Computing and Health Data Infrastructure
Major cloud providers – Amazon Web Services (AWS), Microsoft Azure, and Google Cloud — have all built HIPAA-compliant healthcare-specific cloud environments. Cloud migration enables health systems to scale data storage, run analytics at speed, and rapidly deploy new digital health applications without expensive on-premises infrastructure.
6. Blockchain for Health Data Security
While still emerging, blockchain in healthcare is proving valuable for secure medical record management, pharmaceutical supply chain integrity, and patient consent management. Pilot programs at major U.S. health systems show promise in reducing data tampering and improving audit trails.
7. Robotic Process Automation (RPA)
Administrative waste accounts for approximately 34% of total U.S. healthcare expenditure, per a 2023 JAMA study. RPA is automating repetitive back-office tasks including:
Insurance eligibility verification
Prior authorization submissions
Claims scrubbing and resubmission
Patient registration and scheduling workflows
8. Precision Medicine and Genomics
The convergence of digital health and genomics is enabling truly personalized medicine. AI-powered genomic analysis platforms are helping oncologists identify targeted therapies for cancer patients with far greater speed and accuracy. The National Institutes of Health’s All of Us Research Program has already enrolled over 700,000 participants to build the most diverse genomic database in U.S. history.
Proven Benefits of Healthcare Digital Transformation
The business and clinical case for digital transformation is clear. Here’s what health systems are actually achieving:
Benefit Area
Measurable Outcome
Source
Patient Experience
71% of patients prefer providers with strong digital capabilities
Accenture 2024
Operational Efficiency
RPA reduces admin costs by 25–40% in revenue cycle
KLAS Research 2024
Clinical Quality
AI tools reduce diagnostic errors by up to 30%
NEJM Catalyst 2024
Hospital Readmissions
Predictive analytics cuts 30-day readmissions by up to 20%
Health Affairs 2023
Physician Burnout
Ambient AI documentation saves 2.5 hours/day per physician
AMA Survey 2024
Revenue Optimization
Analytics-driven denial management cuts claim denials by 35%
HFMA 2024
Major Challenges in Healthcare Digital Transformation
Let’s be honest — digital transformation is hard. Health systems that go in expecting a smooth, linear journey often hit significant obstacles. Here’s what to watch for and how to navigate them:
1: Legacy System Integration
Most U.S. health systems are running a patchwork of 10–30-year-old legacy systems that weren’t designed to talk to each other. Integrating modern digital tools with legacy EHRs and clinical applications requires careful API strategy, middleware architecture, and phased migration planning. Rushing this creates data silos — the enemy of effective digital transformation.
2: Data Privacy and HIPAA Compliance
Every new digital touchpoint creates new HIPAA compliance obligations. From patient-facing apps to AI algorithms trained on PHI, health systems must build privacy-by-design frameworks. The HIPAA Privacy Rule’s increased enforcement activity (HHS OCR penalties reached record levels in 2023) means compliance cannot be an afterthought.
3: Change Management and Physician Adoption
Technology is only as good as its adoption. A 2024 KLAS survey found that 45% of EHR optimization failures were due to inadequate change management — not technology failure. Clinician engagement, iterative training, and workflow-centric design are critical to driving adoption and achieving ROI.
4: Digital Equity and Health Disparities
Digital transformation risks widening existing health disparities if access is inequitable. Approximately 21 million Americans still lack broadband internet access (FCC, 2024), and elderly, rural, and low-income populations face disproportionate barriers to digital health access. Inclusive design and community health worker programs are essential equity guardrails.
5: Demonstrating and Measuring ROI
Health system boards and CFOs increasingly demand clear ROI timelines for digital investments. The challenge is that many transformational benefits — such as improved patient experience or reduced burnout — are harder to quantify in the short term. Health systems need robust digital health KPI frameworks aligned with both clinical and financial outcomes.
Real-World Digital Transformation Success Stories
Theory matters, but results matter more. Here are three examples of U.S. health systems leading the way:
Cleveland Clinic: AI-Powered Operational Excellence: Cleveland Clinic deployed AI-driven bed management and patient flow algorithms across its enterprise. The result: a 23% reduction in ED wait times and over $40 million in annual operational savings. Their investment in a unified cloud data platform now supports real-time population health monitoring across 7 million patient lives.
Mayo Clinic: Precision Medicine at Scale: Mayo Clinic’s Center for Digital Health has integrated AI into over 50 clinical workflows, from ECG interpretation (Mayo’s AI can detect AFib from a standard ECG with near-cardiologist accuracy) to sepsis prediction. Their remote monitoring platform actively manages over 10,000 chronic disease patients outside of hospital walls, reducing hospitalizations by 38%.
Kaiser Permanente: The Integrated Digital Ecosystem: Kaiser Permanente processes more than 50% of outpatient visits virtually through its integrated digital platform. Their patient portal, kp.org, handles over 60 million secure messages annually. By leveraging a unified EHR with advanced analytics, Kaiser has achieved some of the highest HEDIS quality scores in the nation while maintaining a highly efficient cost structure.
Building Your Digital Transformation Roadmap: A 5-Phase Framework
There is no one-size-fits-all approach to healthcare digital transformation. But the most successful health systems follow a structured, phased framework:
Phase 1 — Digital Readiness Assessment (Months 1–3): Conduct an honest audit of your current technology infrastructure, data governance maturity, and organizational readiness. Identify key pain points, stakeholder priorities, and quick wins.
Phase 2 — Strategy and Architecture Design (Months 3–6): Define your digital north star. Establish a clinical and operational data strategy. Design your target technology architecture and interoperability framework. Align leadership around priorities.
Phase 3 — Foundation Building (Months 6–18): Invest in core infrastructure — cloud migration, EHR optimization, data warehouse, cybersecurity hardening. Launch high-value pilots (telehealth, RPM, AI-assisted documentation).
Phase 4 — Scale and Optimize (Months 18–36): Scale pilots across the enterprise. Deepen data analytics capabilities. Expand patient digital engagement channels. Begin AI deployment for clinical decision support and operational efficiency.
Phase 5 — Continuous Innovation (Ongoing): Build an internal digital innovation capability. Establish a healthcare digital transformation office or center of excellence. Foster a culture of experimentation and learning.
Top 5 Healthcare Digital Transformation Trends to Watch in 2025–2026
1. Generative AI Moves from Pilot to Production
Large language models (LLMs) are being embedded directly into clinical workflows. Microsoft-Nuance DAX Copilot, Google’s MedPaLM 2, and Amazon HealthScribe are automating clinical documentation at scale. Expect health systems to invest heavily in AI governance frameworks and responsible AI policies as these tools proliferate.
2. The Rise of the Healthcare Super App
Patients increasingly expect a single unified digital front door — one app for scheduling, telehealth, messaging, lab results, billing, and care coordination. Epic MyChart, Oracle Health’s patient app, and health system-native apps are competing to become the Amazon of healthcare consumer experience.
3. Ambient Clinical Intelligence
Voice-enabled, ambient AI systems that passively document clinical encounters – without any active input from clinicians — are moving from novelty to necessity. Early adopters report physician satisfaction scores increasing by over 40% after deployment. This is perhaps the single highest-ROI digital investment for health systems in 2025.
4. Decentralized and Home-Based Care Models
The “hospital at home” model, accelerated by CMS’s Acute Hospital Care at Home waiver program, is creating demand for sophisticated remote monitoring, command center operations, and home-based care coordination platforms. This represents a structural shift in where care is delivered and how it’s reimbursed.
5. Healthcare Data Marketplace and Monetization
Health systems are beginning to recognize the commercial value of their de-identified patient data assets. Compliant data partnerships with life sciences companies, health plans, and analytics firms are creating new revenue streams. Robust data governance and privacy-preserving technologies (like federated learning) will be critical enablers.
Conclusion: The Future of Healthcare Is Digital and the Time Is Now
Digital transformation in healthcare isn’t a destination — it’s a continuous journey of improvement, adaptation, and innovation. The health systems that are winning today aren’t the ones with the biggest budgets or the newest technology. They’re the ones with the clearest strategy, the most engaged leadership, and the courage to reimagine how care can be delivered.
The convergence of AI, interoperability, virtual care, and consumer-grade digital experiences is creating a once-in-a-generation opportunity to fundamentally improve American healthcare — to make it safer, more equitable, more efficient, and more human.
The question for health system leaders is no longer whether to transform digitally. The question is how fast, how bold, and with which partners.
Frequently Asked Questions (FAQs)
These are among the most commonly searched questions on digital transformation in healthcare — answered directly for U.S. health system leaders:
1: What is the biggest challenge in healthcare digital transformation?
The biggest challenge is not technology — it’s people and processes. Change management, physician adoption, and organizational culture alignment are consistently ranked as the top barriers to successful digital transformation. A 2024 KLAS report found that 45% of EHR and digital health project failures were attributed to change management issues rather than technology limitations.
2: How much does healthcare digital transformation cost?
Costs vary significantly based on organizational size, scope, and ambition. A community hospital digital transformation initiative may require $2–10 million over 3 years. A large integrated delivery network undertaking enterprise-wide transformation may invest $50–300+ million. However, the ROI case is strong: every dollar invested in digital health infrastructure has been shown to generate $2.50–5.00 in operational savings and quality improvement value over a 5-year horizon (Deloitte, 2024).
3: What is the role of AI in healthcare digital transformation?
AI is becoming the central engine of healthcare digital transformation. Key AI use cases in 2025 include clinical documentation automation, diagnostic imaging AI, predictive analytics for population health, revenue cycle optimization, and personalized care recommendation engines. The FDA has cleared over 700 AI/ML-enabled medical devices, and that number is growing rapidly.
4: How does telehealth fit into healthcare digital transformation?
Telehealth is one of the highest-impact and fastest-ROI components of healthcare digital transformation. It extends care access, reduces overhead costs for both providers and patients, and is a critical enabler of value-based care models. Health systems investing in telehealth as part of a broader virtual care strategy — including remote patient monitoring, asynchronous messaging, and digital therapeutics — consistently outperform peers on patient satisfaction and cost metrics.
5: What does HIPAA compliance mean for digital health technology?
HIPAA compliance requires that any digital health technology handling Protected Health Information (PHI) must meet strict data security, privacy, and breach notification requirements. This includes Business Associate Agreements (BAAs) with technology vendors, encryption of PHI at rest and in transit, access controls, audit logging, and documented risk analysis processes. Health systems must conduct thorough vendor due diligence and maintain ongoing compliance monitoring.
6: How long does healthcare digital transformation take?
There is no finish line — digital transformation is continuous. However, meaningful progress in foundational areas (EHR optimization, telehealth, data infrastructure) can be achieved in 12–24 months. More ambitious transformations involving AI deployment, enterprise data platforms, and full-scale virtual care programs typically operate on 3–5 year roadmaps. The key is delivering measurable value at each phase to maintain organizational momentum and stakeholder confidence.
7: What is interoperability and why does it matter?
Healthcare interoperability refers to the ability of different health IT systems, devices, and applications to access, exchange, integrate, and cooperatively use data across organizational and geographic boundaries. It matters because fragmented data is one of the leading causes of medical errors, care gaps, and administrative waste. The 21st Century Cures Act mandates that health systems and EHR vendors enable open data exchange through standardized FHIR APIs — making interoperability both a regulatory requirement and a strategic competitive advantage.
8: Can small and rural hospitals benefit from digital transformation?
Absolutely and in many cases, digital transformation is even more critical for small, rural, and critical access hospitals (CAHs). Telehealth partnerships can bring specialist access to underserved communities. Remote patient monitoring can reduce costly patient transfers. Cloud-based analytics can help small hospitals punch above their weight on quality metrics. Federal funding programs including HRSA grants and the CMS Rural Health initiative offer specific financial support for digital health investments in rural settings.
You’ve heard about Ozempic everywhere on the news, from your doctor, maybe even from a neighbor who swears by it. And if you’re on Medicare, the question burning in your mind is probably a simple one: Will Medicare pay for this?
The short answer? It depends and the rules are changing fast.
As of 2026, Medicare does cover Ozempic, but only under specific circumstances. If you have Type 2 diabetes, there’s a good chance your Part D plan has you covered. If you’re hoping to use it for weight loss alone, you’ve hit a legal wall for now. But major policy changes on the horizon could flip that reality by mid-2026.
This guide breaks it all down in plain English – no insurance jargon, no runaround so you can walk into your next doctor’s appointment (or phone call with your insurer) fully informed.
What is Ozempic and Why Does Everyone Want It?
Before diving into coverage, let’s make sure we’re all on the same page about what Ozempic actually is.
Ozempic (semaglutide) is a once-weekly injectable medication made by Novo Nordisk. The FDA first approved it in 2017 for the treatment of Type 2 diabetes, specifically to help adults manage blood sugar levels. It also reduces the risk of major cardiovascular events like heart attack and stroke in adults with Type 2 diabetes and existing heart disease. More recently, it gained approval for reducing the risk of worsening kidney disease.
Ozempic belongs to a class of drugs called GLP-1 receptor agonists (glucagon-like peptide-1). These drugs work by:
Stimulating your pancreas to release insulin when blood sugar rises
Slowing down how quickly food leaves your stomach
Reducing the amount of sugar your liver produces
Signaling your brain that you’re full, which is where the weight loss side effect comes from
That last point is what launched Ozempic into pop culture stardom. Although Ozempic is not FDA-approved for weight loss, many people experience significant weight reduction as a side effect. This led to widespread off-label use and a massive demand surge that Medicare beneficiaries are caught right in the middle of.
Does Medicare Cover Ozempic in 2026?
Here’s the straightforward breakdown:
Medicare DOES Cover Ozempic For:
Type 2 diabetes management — Most Medicare Part D prescription drug plans cover Ozempic when a doctor prescribes it for blood sugar control.
Cardiovascular risk reduction — If you have Type 2 diabetes and a history of heart disease, Ozempic may be covered for reducing the risk of heart attack or stroke.
Kidney disease prevention — Coverage may also apply for adults with Type 2 diabetes and chronic kidney disease.
Medicare Does NOT Currently Cover Ozempic For:
Weight loss — Full stop. A 2003 federal law (the same one that established Medicare Part D) explicitly prohibits Part D plans from covering drugs used solely for weight loss.
Off-label use — If your doctor prescribes Ozempic for any purpose other than its FDA-approved indications, Medicare will not cover it.
Important: Just because a drug appears on your plan’s formulary (drug list) doesn’t automatically mean you qualify for coverage. You’ll need documented proof of your diagnosis typically a confirmed Type 2 diabetes diagnosis to get coverage approved.
How Medicare Part D Covers Ozempic?
Medicare Part D is the prescription drug component of Medicare. It’s offered either as a standalone Part D plan (paired with Original Medicare) or bundled into a Medicare Advantage (Part C) plan.
Here’s how Ozempic coverage works within Part D:
1. Formulary Placement
Most Part D plans list Ozempic on their formulary, usually in Tier 3 or Tier 4 — which means it’s a “non-preferred brand” or “specialty drug.” The tier determines your copay or coinsurance amount, and costs can vary significantly from plan to plan.
2. Prior Authorization
Many Part D plans require prior authorization before covering Ozempic. This means your doctor must submit documentation proving that the medication is medically necessary for your approved condition. Don’t skip this step – it’s one of the most common reasons claims get denied.
3. Step Therapy
Some plans require you to try a less expensive diabetes medication first before they’ll approve Ozempic. This is called “step therapy.” If you’ve already tried other treatments that didn’t work, your doctor can usually document that to bypass this requirement.
4. Quantity Limits
Plans may also set quantity limits on how much Ozempic you can fill per month. Make sure you check your plan’s specific rules.
How Much Does Ozempic Cost Under Medicare?
Without coverage, Ozempic has a list price of approximately $997.58 per monthly injection – a significant financial burden for most seniors on fixed incomes.
With Medicare Part D coverage, your out-of-pocket costs depend on your plan’s design. Here’s what you should know for 2026:
Annual out-of-pocket cap: In 2026, Medicare Part D limits yearly out-of-pocket costs for covered drugs to $2,100 – a major improvement for people on expensive medications.
Deductibles and coinsurance still apply until you hit that cap.
Without diabetes coverage: You’d be paying full list price nearly $1,000/month, which is why the upcoming policy changes matter so much.
The Big News: Medicare Coverage for Ozempic Is Expanding
This is where things get genuinely exciting for Medicare beneficiaries who need Ozempic for weight management.
The BALANCE Model (Starting 2026–2027)
On December 23, 2025, the Centers for Medicare & Medicaid Services (CMS) announced the BALANCE Model which stands for Better Approaches to Lifestyle and Nutrition for Comprehensive Health. This is a five-year demonstration program designed to expand GLP-1 drug coverage to more Medicare beneficiaries.
Here’s the timeline:
May 2026: BALANCE begins for Medicaid
July 2026: A six-month “bridge” program launches for Medicare Part D beneficiaries
January 2027: Full Medicare Part D phase-in begins
The GENEROUS Model
In November 2025, President Trump announced the GENEROUS Model (GENErating cost Reductions fOr U.S. Medicaid) in partnership with pharmaceutical companies Eli Lilly and Novo Nordisk. This model extends GLP-1 coverage to both Medicare and Medicaid beneficiaries who don’t have Type 2 diabetes — specifically targeting obesity.
What Will Beneficiaries Pay?
Under the new pilot programs, the anticipated cost structure looks like this:
Medication
Program Cost
Beneficiary Copay
Ozempic / Mounjaro (diabetes doses)
~$245/month
~$50/month
Wegovy / Zepbound (obesity doses)
~$350/month
~$50/month
This compares to the current list price of $997–$1,350/month without coverage — a dramatic reduction.
Who Will Qualify?
To qualify for GLP-1 coverage under the new obesity-focused programs, preliminary criteria suggest beneficiaries must have:
A BMI over 35, OR
A BMI of 27 or higher combined with at least one weight-related health condition (like high blood pressure, sleep apnea, or cardiovascular disease)
One important caveat: Plans must opt in to the pilot program. Not every Part D or Medicare Advantage plan will automatically offer this benefit, so you’ll want to confirm with your specific insurer.
Medicare Drug Price Negotiations
In January 2025, CMS selected Ozempic, Rybelsus, and Wegovy for its second round of Medicare drug price negotiations. The negotiated prices are expected to take effect in 2027, with a projected cost of around $274 for a 30-day supply down from the current near-$1,000 list price.
What about Wegovy – is it Different?
Yes and this is a distinction that trips a lot of people up.
Wegovy is the same active ingredient as Ozempic (semaglutide), but it’s FDA-approved specifically for weight management in adults with obesity or overweight combined with a weight-related condition.
Here’s how Medicare covers Wegovy differently:
Cardiovascular disease + obesity/overweight: In March 2024, the FDA approved Wegovy to reduce cardiovascular risk in adults with established heart disease who are also overweight or obese. This opened the door for Medicare Part D plans to cover Wegovy — but only for this specific indication, not for weight loss alone.
MASH (liver disease): In mid-2025, the FDA approved Wegovy for metabolic-associated steatohepatitis, which may create additional coverage pathways.
Weight loss only: Still not covered by Medicare under current law.
If you have documented cardiovascular disease and meet the BMI criteria, talk to your doctor – you may qualify for Wegovy coverage right now, before the pilot programs even launch.
What About Mounjaro and Zepbound?
While this article focuses on Ozempic, it’s worth knowing how Medicare handles the other major GLP-1 drugs:
Mounjaro (tirzepatide): Covered by most Part D plans for Type 2 diabetes management.
Zepbound (tirzepatide): May be covered when prescribed to treat obstructive sleep apnea in adults with obesity – not for weight loss alone.
Does Medicare Advantage Cover Ozempic?
Medicare Advantage (Part C) plans are offered by private insurance companies and must cover everything Original Medicare covers but they often include additional benefits.
Some Medicare Advantage plans may offer more favorable Ozempic coverage depending on your plan’s formulary. However, the same federal restriction applies: no coverage for weight loss as the sole indication.
If you’re shopping for a Medicare Advantage plan and Ozempic coverage is a priority, compare plan formularies carefully and call the insurer directly to ask about their specific coverage rules.
What Medicare DOES Cover for Weight Management
Even if you don’t qualify for Ozempic coverage right now, Medicare still offers several weight-related benefits:
Intensive Behavioral Therapy (IBT) for Obesity
Covered under Medicare Part B
Available if you have a BMI of 30 or higher
Must be performed by a primary care provider in a primary care setting
No cost to you – coinsurance and the Part B deductible are waived
Medical Nutrition Therapy (MNT)
Covered under Part B if you have diabetes or kidney disease and your doctor refers you
Provides individualized nutrition counseling with a registered dietitian
Bariatric Surgery
Covered for certain conditions when specific medical criteria are met
Talk to your doctor to determine if you qualify
How to Get Ozempic Covered by Medicare: Step-by-Step
If you have Type 2 diabetes and want to pursue Ozempic coverage through your Medicare Part D plan, here’s what to do:
Step 1: Confirm your diagnosis is documented. Your doctor needs to have a formal Type 2 diabetes diagnosis in your medical records. Verbal acknowledgment isn’t enough.
Step 2: Check your plan’s formulary. Log in to your Part D plan’s website or call member services. Search for Ozempic (semaglutide) and note the tier placement and any coverage restrictions.
Step 3: Ask your doctor for a prior authorization. Request that your doctor’s office submit the necessary prior authorization paperwork to your insurance plan.
Step 4: Inquire about step therapy exceptions. If you’ve already tried other diabetes medications without success, make sure your doctor documents this. It may help you skip the step therapy requirement.
Step 5: Appeal if denied. If your claim is denied, you have the right to appeal. Your doctor can help by submitting a letter of medical necessity.
Ways to Save on Ozempic If Medicare Won’t Cover It
If you’re not eligible for Medicare coverage of Ozempic, you’re not completely out of options:
Novo Nordisk Savings Offer: The manufacturer sometimes offers introductory pricing for new patients paying cash – reportedly around $199/month for eligible patients.
GoodRx, SingleCare, WellRx: Online discount platforms compare pharmacy prices and can significantly reduce your out-of-pocket cost.
Patient Assistance Programs (PAPs): Novo Nordisk offers a patient assistance program for people who meet income criteria.
Employer insurance: If you’re still working or covered under a spouse’s employer plan, check that plan’s GLP-1 coverage – nearly all employer plans now cover GLP-1s for diabetes, and about half of large employer plans (500+ employees) cover them for weight loss.
TrumpRx: The White House announced this drug discount initiative in 2025, which provides links to manufacturer discounts directly.
Real Talk: What This Means for You
Let’s bring this home with a couple of scenarios that illustrate how these rules play out in real life.
Scenario 1 — Margaret, 68, with Type 2 diabetes: Margaret was diagnosed five years ago and her doctor recommends Ozempic to better control her A1C levels. She has a Medicare Part D plan. With prior authorization from her doctor documenting her diabetes diagnosis, her plan covers Ozempic at a Tier 3 copay of around $47/month. She pays a fraction of the list price.
Scenario 2 — David, 72, without diabetes but with obesity: David’s doctor thinks Ozempic could help him lose weight and reduce strain on his joints. But because David doesn’t have a diabetes diagnosis, his Medicare Part D plan won’t cover it. He’s paying $997/month out of pocket — and he’s watching the 2026 pilot program news very closely.
Scenario 3 — Linda, 70, with heart disease and obesity: Linda was diagnosed with cardiovascular disease last year. Her doctor prescribes Wegovy – not Ozempic specifically to reduce her cardiovascular risk. Because Wegovy is FDA-approved for that purpose and Linda meets the criteria, her Part D plan covers it.
Frequently Asked Questions (FAQs)
Does Medicare Part D cover Ozempic for weight loss?
No. As of 2026, federal law prohibits Medicare Part D from covering medications prescribed solely for weight loss. However, pilot programs launching in mid-2026 may change this for eligible beneficiaries.
Is Ozempic covered by Medicare if I have diabetes?
Yes. Most Medicare Part D plans cover Ozempic when it’s prescribed for Type 2 diabetes management. You’ll likely need prior authorization and your plan must list Ozempic on its formulary.
What is the cost of Ozempic with Medicare Part D?
It varies by plan and tier placement, but you should expect copays or coinsurance after meeting your deductible. In 2026, the out-of-pocket cap is $2,100/year for covered drugs, providing meaningful protection against high costs.
Will Medicare cover Ozempic for heart disease?
Medicare may cover Ozempic if you have Type 2 diabetes and heart disease, as the FDA has approved semaglutide for reducing cardiovascular risk in that population. Talk to your doctor and check with your specific plan.
What is the difference between Ozempic and Wegovy for Medicare coverage?
Both contain semaglutide, but they’re FDA-approved for different uses. Ozempic is approved for Type 2 diabetes; Wegovy is approved for cardiovascular risk reduction in people with established heart disease and obesity/overweight. Medicare may cover Wegovy for the cardiovascular indication in eligible patients.
When will Medicare start covering Ozempic for weight loss?
A pilot program (the BALANCE Model and GENEROUS Model) is expected to begin making GLP-1 drugs more accessible for obesity treatment starting mid-2026. Full Medicare Part D coverage through negotiations is targeted for 2027, when negotiated prices around $274/month are expected to take effect.
Can my doctor prescribe Ozempic off-label and have Medicare cover it?
No. Medicare Part D does not cover off-label prescriptions for Ozempic or any other GLP-1 medication.
Does Medicaid cover Ozempic?
Most state Medicaid programs cover Ozempic for Type 2 diabetes treatment, though coverage rules vary by state. Some states require step therapy or prior authorization. The BALANCE and GENEROUS Models also aim to expand Medicaid GLP-1 access for obesity starting in 2026.
How do I appeal a Medicare denial for Ozempic?
If your Part D plan denies coverage, you can file a formal appeal. Work with your doctor to provide a detailed letter of medical necessity, and submit the appeal within the timeframe specified in your denial notice.
Is there a generic version of Ozempic covered by Medicare?
As of early 2026, there is no FDA-approved generic version of Ozempic. However, the FDA approved an oral version of Wegovy (a semaglutide pill) expected to be available in early 2026, which may open up additional coverage options.
The Bottom Line
Navigating Medicare coverage for Ozempic isn’t simple but it’s not hopeless either. Here’s a quick summary of where things stand:
You have Type 2 diabetes? You very likely qualify for Ozempic coverage under Medicare Part D – talk to your doctor and check your formulary.
You want it for weight loss only? Coverage isn’t available under current law, but 2026 and 2027 will bring major changes worth watching.
You have heart disease and obesity? Ask your doctor about Wegovy – you may already qualify for coverage right now.
You’re paying out of pocket? Explore manufacturer discounts, GoodRx, and patient assistance programs to reduce your costs while you wait for policy changes to catch up.
The policy landscape is shifting more rapidly than at any time in Medicare’s history when it comes to GLP-1 drugs. Staying informed and proactive could save you hundreds of dollars a month.
Take Action Today
Don’t wait for the next annual enrollment period to figure this out.
Here’s your action plan:
Call your Medicare Part D plan (the number is on your member ID card) and ask specifically whether Ozempic or Wegovy is covered under your diagnosis.
Talk to your doctor at your next appointment about whether Ozempic is appropriate for you and what documentation they can provide to support a prior authorization.
Check back on Medicare.gov for updates on the BALANCE program rollout and eligibility details as they are announced.
Compare plans during the next Open Enrollment Period (October 15 – December 7) if your current plan doesn’t cover Ozempic and a competitor’s plan does.
The right coverage could make a $1,000/month medication accessible at $50/month and that’s worth a phone call.
Imagine this: you just had a serious medical procedure. Your doctor has recommended follow-up rehabilitation at a specialized facility. You’ve paid your premiums faithfully all year. Then comes the letter – your Medicare Advantage plan has denied the claim. Sound familiar? You’re not alone.
More than 34 million Americans are currently enrolled in Medicare Advantage (MA) plans. While many seniors sign up expecting seamless, affordable coverage, thousands find themselves stuck with plans that deny care, restrict providers, or leave them with sky-high out-of-pocket bills.
In this comprehensive guide, we break down the worst Medicare Advantage plans – what makes a plan bad, which insurers have earned the lowest ratings, what red flags to watch for, and how to protect yourself during open enrollment. Whether you’re choosing a plan for the first time or reconsidering your current coverage, this is the guide you need.
What Makes a Medicare Advantage Plan ‘The Worst’?
Not all Medicare Advantage plans are created equal. The quality gap between the best and worst plans is staggering and it can directly impact your health and financial wellbeing. Experts and regulators use several key indicators to identify low-quality plans.
1. Low CMS Star Ratings
Every year, the Centers for Medicare & Medicaid Services (CMS) rates Medicare Advantage plans on a 1-to-5-star scale. Plans are judged on customer service, member experience, preventive care, chronic disease management, and drug plan performance.
The concerning trend: The average star rating (weighted by enrollment) fell from 4.14 in 2023 to 4.04 in 2024. For 2025, CMS flagged eight contracts with a ‘low performing’ icon — up from six the year before. Seven of those eight were Medicare Advantage plans.
Red Flag: Any plan with 3 stars or below should be approached with extreme caution. CMS considers plans with consistently low ratings as failing to meet quality benchmarks.
2. High Prior Authorization Denial Rates
Prior authorization (PA) is the process where your insurer must approve a service or medication before you receive it. While Original Medicare requires PA for only a limited set of services, Medicare Advantage plans routinely require it for far more and deny it far too often.
Key data point: According to KFF, nearly 53 million prior authorization requests were submitted to Medicare Advantage insurers in 2024, and 4.1 million – roughly 7.7% were denied outright.
What’s alarming is that when denied patients appeal these decisions, they succeed over 80% of the time. This suggests many initial denials are inappropriate — and the worst plans use denials as a cost-cutting tool at patients’ expense.
3. Poor Member Satisfaction Scores
The 2025 J.D. Power Medicare Advantage Study surveyed nearly 11,000 enrollees and found that overall satisfaction dropped 29 points to just 623 out of 1,000 – the steepest decline in the study’s 11-year history. The primary driver? A 39-point collapse in member trust.
Only 38% of first-year members say their plan fulfills their service expectations
Common complaints include confusing explanation of benefits, difficulty finding in-network doctors, and prior authorization delays
Highmark New York ranked as the lowest-rated plan for customer satisfaction in 2025
4. Narrow Provider Networks
Restricted networks are a hallmark of low-quality Medicare Advantage plans. Unlike Original Medicare – where you can see any provider that accepts Medicare anywhere in the country – MA plans typically limit you to an approved network. The worst plans have narrow networks that exclude major hospitals or specialists you depend on.
If your preferred doctor or hospital is suddenly out of network which happens more often than you’d think, since networks change annually – you either pay out-of-pocket or switch providers.
5. Hidden Out-of-Pocket Costs
The maximum out-of-pocket limit for in-network care in 2026 is $9,250 and that doesn’t include prescription drug costs. Prescription costs are separately capped at $2,100 in 2026. The worst plans are structured so that beneficiaries hit these limits quickly, especially for serious or chronic conditions.
The fine print matters: Plans advertise $0 premiums but fail to disclose high copays, strict prior authorization rules, or the cost of out-of-network emergencies.
Major Insurers With Declining Ratings in 2025–2026
While individual plan performance varies by region, several major national carriers have seen notable declines in quality metrics. Here’s what the data reveals:
UnitedHealthcare
CMS 2025 Star Rating: Average 3.5–4.0 across contracts, with a year-over-year decline of 0.39 stars — worse than the industry average.
Enrollment: UnitedHealthcare is the largest Medicare Advantage insurer with 9.9 million members in 2025.
Despite its massive scale, UnitedHealthcare has faced scrutiny for prior authorization denials and network changes. Its stock fell approximately 36% year-to-date as of December 2025, reflecting financial pressures that can translate to benefit cuts.
Announced plans to scale back Medicare Advantage offerings in 2026
Engaged in legal disputes with CMS over star rating methodologies
Members in some regions reported unexpected network changes mid-year
Humana
Star Rating Drop: Humana saw the largest average star rating decline among the top 15 plans — a drop of 0.74 stars — representing a significant quality erosion.
Humana has cut supplemental benefits in recent years to manage rising medical costs. While it has stabilized some offerings for 2026, the insurer’s stock also declined significantly, and the company announced plans to scale back its MA footprint.
Cut dental, vision, and hearing benefits in multiple markets
Increased prior authorization requirements for certain services
Members auto-transferred to different plans due to consolidations
Centene
Prior Authorization Concern: Centene had one of the highest prior authorization denial rates among major Medicare Advantage insurers, according to Kiplinger. While its appeals overturn rate was high (93.6%), this means a huge proportion of initial denials were likely inappropriate.
With only about 1.1 million MA enrollees and a 2% market share, Centene’s outsized denial rate makes it particularly concerning for the seniors who depend on it.
CVS Health / Aetna
CMS Star Ratings: Most Aetna plans are rated 3–4 stars. CVS Health had the second-highest prior authorization denial rate among major insurers, with 89.7% of its appealed denials overturned — again suggesting many denials were unwarranted.
With a 12% market share and 4.1 million enrollees, even a fraction of unnecessary denials affects hundreds of thousands of Americans.
Zing Health
Among smaller plans, Zing Health had one of the lowest-performing contracts in the 2025 CMS star ratings — a warning sign for members in markets where Zing operates.
Highmark New York
According to the 2025 J.D. Power study, Highmark New York ranked dead last for member satisfaction in its market — a distinction no plan wants and no enrollee deserves.
Red Flags That Identify the Worst Medicare Advantage Plans
So how do you spot a bad Medicare Advantage plan before you’re locked into it? Here are the red flags that consumer advocates and healthcare experts say to watch closely:
Low CMS Star Rating (below 3.5 stars): CMS publishes star ratings every fall before open enrollment. Plans with 3 stars or below are consistently underperforming on care quality and member satisfaction.
High prior authorization requirements: Plans that require prior authorization for a long list of routine services create unnecessary barriers to care. Review a plan’s prior authorization list before enrolling.
Very narrow provider networks: If your current doctors aren’t in-network, that’s a serious problem. Always check the plan’s provider directory and verify independently, since directories are often outdated.
Annual benefit reductions: Plans that keep cutting dental, vision, hearing, or prescription benefits year after year are prioritizing profits over patient care.
High out-of-pocket maximums: In 2026, the maximum is $9,250 for in-network care. Plans near that ceiling offer less financial protection than they appear to.
Confusing or misleading marketing: CMS has reported double-digit increases in complaints about misleading Medicare Advantage marketing. Watch for promises of ‘free’ coverage that ignores copays and restrictions.
Frequent plan consolidations: If a plan keeps merging with others or exiting markets, your coverage and providers could change without warning.
No or minimal digital tools: The J.D. Power study found that digital satisfaction among the highest-performing plans was 98 points higher than among the lowest-performing ones. Poor digital tools signal poor member support overall.
The Prior Authorization Crisis: By the Numbers
Prior authorization has become the single biggest pain point for Medicare Advantage members and the statistics are alarming.
53 million prior authorization requests were submitted in 2024 alone.
4.1 million (7.7%) of those requests were denied – up from under 6% in 2019–2021.
Over 80% of appealed denials are overturned – suggesting widespread inappropriate denials.
Only ~10% of denied patients even bother to appeal – leaving millions without the care they’re entitled to.
73% of Americans say delays and denials of care by health insurers are a ‘major problem,’ according to a 2025 KFF poll.
47% of people who needed prior authorization found the process ‘somewhat’ or ‘very’ difficult to navigate.
The most troubling finding: When Medicare Advantage denials are appealed, they’re overturned 82% of the time. In traditional Medicare, only 29% of appealed denials are overturned. This gap suggests that MA plans are systematically over-denying care.
The Senate Homeland Security Committee’s investigative subcommittee has scrutinized large Medicare Advantage insurers specifically for their high rates of prior authorization denials for post-acute care – like skilled nursing facilities and inpatient rehabilitation – services that are critical for seniors recovering from surgery or illness.
How to Evaluate and Compare Medicare Advantage Plans
The good news: you have more tools than ever to research plans before committing. Here’s a step-by-step framework:
Step 1: Check the CMS Star Rating
Visit Medicare.gov and use the Plan Finder tool. Filter by star ratings. Aim for plans with 4 stars or above. Five-star plans have the added bonus of being available for enrollment year-round.
Step 2: Verify Your Doctors Are In-Network
Don’t rely solely on the plan’s online directory. Call your doctor’s office directly and ask whether they accept the specific Medicare Advantage plan you’re considering — including the specific contract number if possible.
Step 3: Review the Prior Authorization List
Starting in 2026, Medicare Advantage insurers are required to publish a list of all services requiring prior authorization, along with their approval and denial rates. Review this carefully, especially if you have chronic conditions or anticipate surgeries or specialist care.
Step 4: Calculate Your True Costs
Add up the monthly premium plus the expected copays for the services you use most. Compare the total cost – not just the premium against Original Medicare plus a Medigap supplement plan.
Step 5: Check Drug Coverage
Ensure your specific medications are on the plan’s formulary. Drug plan deductibles can be no higher than $615 in 2026, and out-of-pocket prescription costs are capped at $2,100 for 2026. Verify that your drugs are in the lowest possible tier.
Step 6: Read the Annual Notice of Change (ANOC)
Your current plan must send you an ANOC by September 30 each year. This document spells out every change to your benefits, costs, and network for the coming year. Read it carefully and if anything significant has changed, it’s time to compare alternatives during Open Enrollment (Oct 15 – Dec 7).
When to Switch Away From Your Medicare Advantage Plan
You don’t have to stay in a bad plan. Here are the most important times when you can make a change:
Annual Open Enrollment (October 15 – December 7): You can switch to any Medicare Advantage plan or return to Original Medicare. Changes take effect January 1.
Medicare Advantage Open Enrollment (January 1 – March 31): If you’re already in an MA plan and unhappy, you can switch to another MA plan or return to Original Medicare during this window.
Special Enrollment Periods (SEPs): If your plan leaves your area, loses its Medicare contract, or if you move, you may qualify for a Special Enrollment Period to switch plans outside the normal window.
5-Star Enrollment: Five-star plans can be joined at any time during the year – a major advantage if you miss open enrollment.
Important: Switching from Medicare Advantage back to Original Medicare may be difficult if you have pre-existing conditions and want to buy a Medigap supplement policy. In most states, Medigap insurers can use medical underwriting outside of specific guaranteed issue windows. Consider this carefully before switching.
Medicare Advantage vs. Original Medicare: The Real Comparison
For many seniors, especially those with complex health needs, Original Medicare paired with a Medigap supplement plan provides superior protection. Here’s a quick comparison:
Provider Access: Original Medicare allows you to see any provider that accepts Medicare nationwide. Medicare Advantage restricts you to an in-network panel.
Prior Authorization: Original Medicare requires PA for a small set of services. Medicare Advantage can require PA for a far broader list.
Travel Coverage: Original Medicare covers you across all 50 states. Most Medicare Advantage plans only cover emergency care outside their service area.
Out-of-Pocket Predictability: Medigap plans can cover nearly all of Original Medicare’s cost-sharing, offering far more financial predictability than MA plans.
Extra Benefits: Medicare Advantage plans often include dental, vision, and hearing. Original Medicare does not – though standalone plans are available.
The bottom line: if your priority is access to any doctor, minimal paperwork, and predictable costs – especially if you have serious or complex health needs – Original Medicare with Medigap may serve you better than the average Medicare Advantage plan.
Take Action Before Open Enrollment Closes
Don’t wait until you’re denied care to realize your plan isn’t working for you. Take these steps today:
Visit Medicare.gov/plan-compare to check your plan’s star rating
Call 1-800-MEDICARE (1-800-633-4227) for free, unbiased assistance
Contact your State Health Insurance Assistance Program (SHIP) for personalized guidance at no cost
Report misleading marketing or wrongful denials to 1-800-MEDICARE or your State Senior Medicare Patrol (SMP)
Frequently Asked Questions (FAQ)
Q: How do I find out if my Medicare Advantage plan is rated poorly?
Visit Medicare.gov and use the Medicare Plan Finder. Every plan shows its CMS star rating from 1 to 5 stars. Plans rated 3 stars or below are considered low-performing. You can also view ‘low performing’ icons on the Plan Finder for plans that have consistently failed quality benchmarks.
Q: Which Medicare Advantage plan has the most complaints?
Complaint data varies by region, but national data from J.D. Power’s 2025 study identified Highmark New York as the lowest-ranked plan for member satisfaction. CMS also maintains a low-performing plan list with eight contracts flagged for 2025 – primarily Medicare Advantage plans. Centene and CVS Health/Aetna also drew attention for high prior authorization denial rates.
Q: Can I switch out of a bad Medicare Advantage plan mid-year?
In most cases, you can only switch during the Annual Open Enrollment Period (October 15 – December 7) or the Medicare Advantage Open Enrollment Period (January 1 – March 31). However, certain life events – like moving, losing other coverage, or your plan losing its Medicare contract – may qualify you for a Special Enrollment Period that allows mid-year changes.
Q: What happens if my Medicare Advantage plan denies a claim?
You have the right to appeal. Request a written denial notice if you haven’t received one, then file a formal appeal with your plan. If the plan upholds the denial, you can escalate to an independent review entity. Statistics show that over 80% of appeals are successful, so it is absolutely worth fighting an unjust denial. Contact 1-800-MEDICARE or your SHIP counselor for free help navigating the appeals process.
Q: Is Original Medicare better than Medicare Advantage?
It depends on your individual health needs, finances, and priorities. Original Medicare offers nationwide provider access with no network restrictions and minimal prior authorization requirements. Paired with a Medigap supplement plan, costs become highly predictable. Medicare Advantage can offer lower premiums and extra benefits like dental and vision, but often comes with restricted networks, prior authorization hurdles, and less financial predictability. For those with complex or chronic health conditions, Original Medicare with Medigap is often the safer choice.
Q: What is the out-of-pocket maximum for Medicare Advantage in 2026?
The in-network out-of-pocket maximum for Medicare Advantage plans in 2026 is $9,250. Note that prescription drug costs are handled separately and are capped at $2,100 in 2026. Out-of-network costs may be even higher, depending on your plan type.
Q: How do I report a bad Medicare Advantage plan or misleading marketing?
You can file a complaint directly with CMS by calling 1-800-MEDICARE (1-800-633-4227), available 24/7. You can also contact your State Health Insurance Assistance Program (SHIP), file a complaint with your state insurance department, or report suspected fraud or abuse to your regional Senior Medicare Patrol (SMP).
Q: Do Medicare Advantage plans get worse every year?
Not necessarily, but the trend is concerning. Average star ratings have declined for several consecutive years, and member satisfaction hit a multi-year low in 2025. Several major insurers have scaled back benefits and narrowed networks to manage costs. The landscape is changing rapidly, which makes it more important than ever to review your plan each year during Open Enrollment rather than simply auto-renewing.
Final Thoughts: Your Coverage, Your Health, Your Choice
Medicare Advantage is not inherently bad but the worst plans can genuinely put your health and finances at risk. Low star ratings, aggressive prior authorization denials, narrow networks, and misleading marketing are real problems that affect millions of Americans every year.
The good news is that you have the power to make an informed choice. Use the tools available to you CMS star ratings, J.D. Power satisfaction scores, prior authorization transparency data, and free counseling through SHIP to evaluate every plan on its actual merits, not just its marketing.
Your health is too important to leave to chance or a slick advertisement. Review your plan annually, know your rights, and don’t hesitate to switch if your plan isn’t serving you well.
Quick Summary: The Inpatient Prospective Payment System (IPPS) is the primary method Medicare uses to reimburse acute care hospitals for inpatient services. It pays a fixed, predetermined rate based on each patient’s Medicare Severity Diagnosis-Related Group (MS-DRG). For FY 2026, CMS finalized a 2.6% increase in operating payment rates, effective October 1, 2025. This comprehensive guide breaks down how IPPS works, what’s new, and what healthcare professionals need to know.
What Is the Inpatient Prospective Payment System (IPPS)?
Picture this: A Medicare patient walks into a hospital with a serious pneumonia infection. The clinical team provides excellent care — lab tests, antibiotics, breathing treatments, and a four-day stay. When it’s time to settle the bill, how does Medicare decide what to pay?
The answer lies in a system that fundamentally transformed American healthcare finance over four decades ago: the Inpatient Prospective Payment System, or IPPS.
The IPPS is a Medicare reimbursement framework established under Section 1886(d) of the Social Security Act that pays acute care hospitals a flat, predetermined rate for each inpatient stay. Instead of reimbursing hospitals for whatever they happen to spend, CMS sets the payment in advance — based on the patient’s diagnosis, medical complexity, and the typical cost of treating similar cases nationwide.
Since its inception in October 1983, the IPPS has been the backbone of Medicare hospital reimbursement. It affects how thousands of US hospitals budget, staff, code, and deliver care. If you work in healthcare administration, medical coding, hospital finance, or health policy, understanding IPPS isn’t just useful — it’s essential.
This guide walks you through everything: how IPPS works, how payment is calculated, the latest FY 2026 updates, key quality programs tied to reimbursement, and what healthcare professionals should watch for in the coming years.
A Brief History of IPPS: Why Was It Created?
The Pre-IPPS Era: Cost-Based Reimbursement
Before 1983, Medicare paid hospitals using a cost-based reimbursement model. In simple terms: the more hospitals spent, the more they got paid. There was almost zero incentive to be efficient.
The results were predictable. Medicare inpatient hospital costs soared from $3 billion in 1967 to $37 billion by 1982. Researchers found a staggering six-fold variation in what Medicare paid individual hospitals for treating the same condition — like an acute heart attack — with no clinically justifiable reason for that disparity. The system was unsustainable.
The 1983 Reform: The Birth of DRG-Based Payment
Under President Reagan, Congress passed the Social Security Amendments of 1983, which included a sweeping overhaul of Medicare hospital reimbursement. Effective October 1, 1983, the IPPS replaced cost-based reimbursement with a prospective, per-discharge payment system based on Diagnosis-Related Groups (DRGs).
The core logic was elegant: group patients with similar diagnoses and resource needs together, calculate the average cost of treating them, set a standard payment for each group, and let hospitals keep any savings if they deliver care more efficiently.
The system had four chief objectives, as defined by Congress:
Ensure fair compensation for services without compromising patient access
Account for new medical technology in payment rate updates
Promote hospital efficiency while maintaining quality
Ensure the financial stability of the Medicare Hospital Insurance Trust Fund
Over 40 years later, IPPS remains the foundational payment model for Medicare inpatient care, though it has evolved substantially with quality incentives, value-based programs, and annual regulatory updates.
How Does IPPS Work? The Step-by-Step Payment Process
At its core, IPPS works by grouping each patient’s hospital stay into a standardized payment category and applying a predetermined rate. Here’s how the process unfolds:
Step 1: Patient Admission and Discharge
When a Medicare beneficiary is admitted to an acute care hospital as an inpatient, the clock starts. During the stay, the clinical team documents all diagnoses, procedures, and complicating conditions in the medical record.
Step 2: Medical Coding
At discharge, trained medical coders translate the clinical documentation into ICD-10-CM diagnosis codes and ICD-10-PCS procedure codes. This step is critically important: accurate and complete coding directly determines which MS-DRG the patient is assigned to — and therefore how much the hospital gets paid.
Key coding elements include:
Principal diagnosis (the primary reason for admission)
Secondary diagnoses (additional conditions that affect care)
Procedures performed during the stay
Patient age, sex, and discharge status
Presence of complications or comorbidities (CCs or MCCs)
Step 3: MS-DRG Assignment via the Grouper
Once coded, the claim goes through an automated software called the “Grouper.” This program assigns the case to one of the Medicare Severity Diagnosis-Related Groups (MS-DRGs) — currently over 740 distinct categories. The Grouper first sorts cases into one of 25 Major Diagnostic Categories (MDCs), largely organized by body system. From there, it narrows down to a specific MS-DRG based on the full coding profile.
MS-DRGs are split by severity level:
MCC (Major Complication or Comorbidity): Highest severity, highest payment
CC (Complication or Comorbidity): Moderate severity, moderate payment
Non-CC: Lowest severity, standard payment
Step 4: Payment Calculation
The hospital’s IPPS payment is calculated using the following formula:
Where the Hospital Base Rate is adjusted for: • Wage Index (reflecting local labor costs) • Disproportionate Share Hospital (DSH) Adjustment (if applicable) • Indirect Medical Education (IME) Adjustment (for teaching hospitals) • Outlier Payments (for extraordinarily costly cases) • New Technology Add-On Payments (NTAP) (for qualifying technologies)
The MS-DRG relative weight is the key driver of payment variation. An MS-DRG with a weight of 2.0 means the hospital gets paid roughly double the base rate, reflecting that those cases are twice as resource-intensive as the average.
Step 5: Additional Adjustments
Beyond the basic formula, several special adjustments can increase IPPS payments:
Disproportionate Share Hospital (DSH): Extra payment for hospitals serving large numbers of low-income patients.
Indirect Medical Education (IME): Additional payment for teaching hospitals that train medical residents.
Outlier Payments: For cases with unusually high costs, a supplemental payment kicks in to protect hospitals from catastrophic financial losses.
New Technology Add-On Payments (NTAP): Temporary additional payments for approved new technologies until their costs are captured in DRG weights.
IPPS by the Numbers: Key Statistics at a Glance
Metric
Value
IPPS Established
October 1983
Number of MS-DRGs (approx.)
Over 740
FY 2025 Hospital Payment Increase
$3.2 billion
FY 2025 Net Operating Rate Increase
2.9%
FY 2026 Operating Rate Increase
2.6%
Hospital VBP Withhold Rate
2% of base DRG payments
HAC Reduction Program Penalty
1% payment reduction for worst quartile
Medicare Part A Coverage (per episode)
90 days + 60-day lifetime reserve
FY 2026 LTCH PPS Annual Update
2.7%
Which Hospitals Are Covered Under IPPS?
Not every hospital in America is paid under the IPPS. The system applies primarily to acute care general hospitals that accept Medicare patients. However, several categories of hospitals are explicitly excluded:
Inpatient psychiatric facility hospitals and units
Inpatient rehabilitation facility (IRF) hospitals and units
Long-term care hospitals (LTCHs) — these are paid under the LTCH PPS
Children’s hospitals
Cancer hospitals exempt from IPPS (11 statutorily designated facilities)
Hospitals outside the 50 states, Washington D.C., and Puerto Rico (e.g., US Virgin Islands, Guam)
Excluded hospital types have their own prospective payment frameworks tailored to their unique patient populations and care models.
IPPS and Quality-Based Payment Programs
Modern IPPS is not purely about volume or diagnosis codes. Over the past two decades, CMS has layered a suite of quality programs onto the IPPS framework that tie hospital payments directly to performance outcomes. These programs reflect the shift from fee-for-service toward value-based care.
1. Hospital Inpatient Quality Reporting (IQR) Program
The Hospital IQR Program requires hospitals to submit quality data on a range of clinical measures. In exchange, hospitals that comply receive the full annual market basket update. Hospitals that fail to participate face a one-quarter reduction to their annual payment update. For FY 2026, CMS finalized updates to the IQR measure set to align with current clinical priorities.
2. Hospital Value-Based Purchasing (VBP) Program
The Hospital VBP Program is a budget-neutral initiative that withholds 2% of base operating DRG payments from all participating hospitals, then redistributes the total pool back as value-based incentive payments based on performance scores. Hospitals that perform above national benchmarks can actually earn back more than the 2% withheld.
Performance domains include clinical outcomes, safety, efficiency, and patient experience (measured through the HCAHPS survey). In the FY 2025 final rule, CMS finalized modifications to HCAHPS survey scoring for FY 2027–2029.
3. Hospital Readmissions Reduction Program (HRRP)
The HRRP penalizes hospitals with excess readmission rates for specific conditions including heart failure, heart attack, pneumonia, hip/knee replacement, COPD, and coronary artery bypass grafting (CABG). Penalties can reduce base operating DRG payments by up to 3%. CMS publishes hospital-specific readmission ratios annually.
4. Hospital-Acquired Condition (HAC) Reduction Program
Hospitals in the worst-performing quartile for hospital-acquired conditions — like bloodstream infections, surgical site infections, and pressure injuries — receive a 1% payment reduction applied to all IPPS discharges for the fiscal year. This program creates a direct financial incentive to invest in patient safety and infection control.
5. Medicare Promoting Interoperability Program
Formerly known as Meaningful Use, this program requires hospitals to demonstrate meaningful use of certified electronic health record (EHR) technology. Hospitals that fail to qualify face a payment reduction. Effective for the CY 2025 EHR reporting period, CMS raised the performance-based scoring threshold from 60 to 70 points, and will further increase it to 80 points beginning with CY 2026.
FY 2025 IPPS Final Rule: Key Updates (Effective October 1, 2024)
The FY 2025 IPPS final rule, issued by CMS on August 1, 2024, brought a range of significant payment and policy changes. Here are the highlights:
Payment Rate Changes
Net operating rate increase: 2.9% for hospitals successfully participating in the Hospital IQR Program and meaningfully using EHRs. This reflects a projected market basket increase of 3.4%, reduced by a 0.5 percentage point productivity adjustment.
Overall payment impact: CMS expected operating and capital IPPS rate changes to increase total hospital payments by $3.2 billion in FY 2025.
DSH uncompensated care payments: Projected to decrease by approximately $0.2 billion.
New technology add-on payments: Increased by approximately $0.3 billion.
Drug Shortage Preparedness: Essential Medicine Buffer Stock
One of the more innovative FY 2025 policies established a new IPPS payment for small independent hospitals (100 beds or fewer) to maintain six-month buffer stocks of 86 essential medicines identified by the Advanced Regenerative Manufacturing Institute (ARMI). This policy aims to prevent future drug shortages and improve supply chain resilience.
Wage Index and Low-Wage Hospital Policy
CMS extended the temporary low-wage index hospital policy (originally finalized in FY 2020) for at least three additional years beginning in FY 2025. This policy helps rural and other low-wage hospitals by boosting their wage indexes, which in turn increases their IPPS payment rates. The extension was driven by the need to evaluate the policy’s effects using post-pandemic wage data.
However, a July 2024 D.C. Circuit Court ruling in Bridgeport Hosp. v. Becerra held that CMS lacked the legal authority to adopt the low-wage index hospital policy for FY 2020, requiring CMS to issue interim guidance and implement revised wage index values.
Graduate Medical Education (GME) Funding
The FY 2025 final rule included $74 million in funding for graduate medical education, supporting 200 additional Medicare-funded physician residency slots distributed from 2026 through 2036 — a meaningful investment in the future physician workforce.
FY 2026 IPPS Final Rule: What’s New (Effective October 1, 2025)
On July 31, 2025, CMS issued the FY 2026 IPPS/LTCH PPS final rule, which took effect October 1, 2025. Here is what changed:
Operating Payment Rate Update
CMS finalized a 2.6% increase in IPPS operating payment rates for hospitals that meet IQR and EHR requirements. This reflects a market basket increase of 3.3% reduced by a 0.7 percentage point productivity adjustment. Hospitals that fail to meet quality or EHR requirements receive a reduced update.
LTCH PPS Update
For long-term care hospitals, CMS finalized a 2.7% annual update to the LTCH standard payment rate for FY 2026. Total LTCH PPS payments for standard rate cases are projected to increase by approximately $72 million.
Discontinuation of Low Wage Index Hospital Policy
Following the Bridgeport Hosp. v. Becerra appellate court decision, CMS finalized the discontinuation of the low-wage index hospital policy for FY 2026 and beyond. To ease the transition for hospitals significantly impacted by this change, CMS adopted a budget-neutral transitional exception for FY 2026.
Quality Program Updates
The FY 2026 rule finalized several quality measure changes, including:
Removal of the Hospital Commitment to Health Equity measure beginning with the CY 2024 reporting period/FY 2026 program year
Removal of the Screening for Social Drivers of Health and Screen Positive Rate for Social Drivers of Health measures, beginning with the CY 2024 reporting period/FY 2026 program year
Updates to the Extraordinary Circumstances Exception (ECE) policy, extending the ECE request window from 30 to 60 days
The Transforming Episode Accountability Model (TEAM)
Originally finalized in the FY 2025 rule, the TEAM model is a mandatory alternative payment model focused on episodes of care beginning with five specific procedures: coronary artery bypass graft (CABG), lower extremity joint replacement, major bowel procedure, surgical hip/femur fracture treatment, and spinal fusion. TEAM tests whether financial accountability for these surgical episodes reduces Medicare spending while maintaining or improving quality.
What IPPS Means for Hospital Finance and Operations
For hospital CFOs, revenue cycle managers, and healthcare administrators, IPPS isn’t an abstract policy concept — it’s a direct driver of financial performance. Here’s how IPPS shapes day-to-day hospital operations:
Revenue Cycle Management
Because IPPS pays a flat rate per discharge, a hospital’s financial performance under IPPS depends heavily on how efficiently it delivers care. If a hospital’s actual costs exceed the MS-DRG payment rate, the hospital absorbs the loss. If costs are below the payment rate, the hospital keeps the surplus. This “keep the savings, absorb the losses” dynamic is the core financial incentive built into IPPS.
Clinical Documentation Improvement (CDI)
One of the most important operational functions in any IPPS hospital is clinical documentation improvement (CDI). CDI specialists review medical records in real time to ensure that physicians’ documentation accurately reflects the severity of patient illness. Missing a documented MCC (major complication or comorbidity) can mean the difference between two very different MS-DRGs — and thousands of dollars in reimbursement.
Case Mix Index (CMI)
The case mix index is the average DRG relative weight for all Medicare discharges at a given hospital. A higher CMI signals that a hospital is treating sicker, more complex patients. IPPS creates a natural incentive for hospitals to accurately document complexity, because a higher CMI translates directly to higher average payments per case.
Length of Stay Management
Under the old cost-based reimbursement system, there was no incentive to discharge patients promptly. Under IPPS, a hospital is paid the same flat rate regardless of whether the patient stays two days or ten days. This created powerful incentives for utilization management, care coordination, and timely discharge planning — all of which benefit both the hospital’s bottom line and patients’ outcomes.
Challenges and Criticisms of IPPS
No payment system is perfect, and IPPS has faced legitimate criticism over the decades. Understanding these challenges helps healthcare leaders navigate the system more effectively.
Rural Hospital Vulnerability: Small rural hospitals often operate with thin margins under IPPS because they serve lower volumes of Medicare patients and have higher per-case costs. Programs like Critical Access Hospital (CAH) designation and the low-volume hospital adjustment exist partly to address these disparities.
Upcoding Concerns: Because payment is tied to MS-DRG assignment, there are financial incentives to code the most complex — and highest-paying — DRG. CMS and OIG actively monitor for inappropriate upcoding.
Technology Lag: New medical technologies may take years to be reflected in MS-DRG weights. The New Technology Add-On Payment (NTAP) program helps bridge this gap, but it has a limited scope.
Uncompensated Care: Hospitals treating large numbers of uninsured or Medicaid patients rely heavily on the DSH uncompensated care pool, which has faced fluctuating funding levels under different legislative environments.
Wage Index Inequities: Geographic wage index differences have historically disadvantaged hospitals in lower-wage regions, a tension exemplified by the Bridgeport Hosp. v. Becerra litigation.
People Also Ask: Common Questions About IPPS
What is the difference between IPPS and OPPS?
The Inpatient Prospective Payment System (IPPS) governs Medicare reimbursement for inpatient hospital stays, while the Outpatient Prospective Payment System (OPPS) covers hospital outpatient services. IPPS uses MS-DRGs as its payment unit, while OPPS uses Ambulatory Payment Classifications (APCs). OPPS was introduced in 2000 and covers procedures, clinic visits, and other services delivered in a hospital outpatient setting.
How is the IPPS base rate determined each year?
CMS updates the IPPS base rate annually through a formal rulemaking process. The update is tied to the hospital market basket index, which tracks changes in the prices hospitals pay for labor, supplies, and other inputs. The raw market basket increase is then reduced by a productivity adjustment (and sometimes by legislative mandates). Hospitals that fail to meet IQR or EHR program requirements receive a further reduced update.
Who is excluded from IPPS?
Hospitals excluded from IPPS include inpatient psychiatric facilities, inpatient rehabilitation facilities, long-term care hospitals (which have their own LTCH PPS), children’s hospitals, 11 designated cancer hospitals, and hospitals located outside the 50 states, D.C., and Puerto Rico. These facilities are paid under separate Medicare payment systems appropriate to their care settings.
What is a Medicare Severity Diagnosis-Related Group (MS-DRG)?
An MS-DRG is a patient classification system used under IPPS to group inpatient hospital cases based on clinical similarity and resource use. Each MS-DRG has a relative weight that reflects the average resource intensity of treating patients in that group, compared to the overall average. Cases are assigned to MS-DRGs based on principal diagnosis, secondary diagnoses, procedures, and patient characteristics. There are over 740 MS-DRGs, and CMS recalibrates their weights annually.
What are IPPS outlier payments?
IPPS outlier payments are additional reimbursements for cases where the hospital’s costs significantly exceed the standard MS-DRG payment. To qualify, the cost of a case must exceed the MS-DRG payment plus a fixed-loss threshold (which CMS updates annually). Outlier payments are designed to protect hospitals from catastrophic financial losses on unusually expensive cases, such as patients who experience major complications or require extremely prolonged care.
How does the Hospital VBP Program relate to IPPS?
The Hospital Value-Based Purchasing (VBP) Program is embedded within the IPPS framework. CMS withholds 2% of each hospital’s base operating DRG payments and redistributes the total pool based on quality performance scores. Hospitals that score above the national benchmark can earn back more than the 2% withheld, while lower-performing hospitals may receive less than their withheld amount. This design links IPPS reimbursement directly to quality outcomes.
Does IPPS cover physician services?
No. Physicians are paid separately under the Medicare Physician Fee Schedule (PFS) for their professional services provided during an inpatient stay. IPPS covers the hospital’s operating and capital costs — including nursing care, room and board, diagnostic services, and hospital-based clinical staff — but does not include physician professional fees, which are billed independently.
The Future of IPPS: Trends to Watch
IPPS has always been a living system, adapting to changes in medical technology, policy priorities, and economic conditions. Looking ahead, several trends are likely to shape its evolution:
Value-Based Care Expansion: CMS continues to move toward tying more IPPS dollars to quality outcomes, alternative payment models, and population health measures. Programs like TEAM signal a broader shift toward episode-based accountability.
Health Equity Integration: While some health equity measures were removed in FY 2026, CMS has signaled long-term interest in using payment policy to reduce disparities. Future rules may introduce new equity-focused measures.
Technology and AI: As AI-assisted diagnosis and new medical technologies proliferate, the NTAP process and MS-DRG recalibration will become increasingly critical to ensure that payment rates reflect actual care costs.
Electronic Health Records and Interoperability: CMS continues to raise EHR performance thresholds under the Promoting Interoperability Program, pushing hospitals toward seamless data exchange and real-time patient information access.
Supply Chain and Drug Shortage Preparedness: The FY 2025 buffer stock policy for essential medicines suggests that future IPPS rules may increasingly address supply chain resilience as a strategic priority.
Conclusion: Why IPPS Mastery Matters
The Inpatient Prospective Payment System is more than a billing mechanism — it is the financial architecture of American hospital care for tens of millions of Medicare patients. Every year, IPPS shapes how hospitals invest in technology, manage their workforce, train residents, control infections, and ultimately deliver care.
For healthcare professionals, staying current with IPPS isn’t optional. Annual rule changes directly affect reimbursement, compliance obligations, quality program performance, and strategic planning. Whether you’re a hospital CFO tracking the FY 2026 rate update, a medical coder mastering the latest MS-DRG reclassifications, or a CDI specialist ensuring documentation accuracy — IPPS is at the center of your work.
The good news is that understanding IPPS empowers hospitals to respond proactively rather than reactively: optimizing documentation, managing utilization, investing in quality, and aligning resources with where Medicare’s value-based programs are headed.
Medicare Secondary Payer rules determine when Medicare becomes the second payer for beneficiaries with other insurance coverage. For U.S. healthcare executives, MSP compliance represents a complex operational challenge with direct financial implications, heightened enforcement risk, and evolving regulatory requirements that demand systematic attention.
What is Medicare Secondary Payer?
Medicare Secondary Payer refers to situations where the Medicare program does not hold primary payment responsibility. When another entity—a group health plan, liability insurer, no-fault insurer, or workers’ compensation program has the obligation to pay first, Medicare becomes the secondary payer.
Enacted in 1980, MSP legislation shifted costs from Medicare to appropriate private payment sources. Before MSP, Medicare paid first for nearly all claims except those covered by Workers’ Compensation, Federal Black Lung benefits, and Veterans Administration benefits. Today, MSP provisions protect the Medicare Trust Fund by ensuring Medicare does not pay for services when other coverage is primarily responsible.
The distinction is operational, not theoretical. Providers must identify primary payers, bill them first, and only submit claims to Medicare after receiving the primary payer’s adjudication. Federal law takes precedence over state laws and private contracts. Even when state law or an insurance policy suggests Medicare should pay first, MSP provisions apply.
Why Medicare Secondary Payer Matters Now
1. Financial Impact on Medicare Trust Fund
MSP savings are substantial. According to the Department of Health and Human Services, MSP laws and regulations reduced Medicare spending by approximately $9.7 billion in fiscal year 2021. These provisions are not peripheral—they are vital to Medicare’s fiscal integrity.
The 2024 Medicare Board of Trustees’ report projects that total Part A spending will exceed incoming revenues by 2030. By 2036, insufficient funds will exist to pay full benefits. MSP recovery and coordination efforts directly address this solvency challenge.
2. Increased CMS Enforcement in 2025
CMS formalized civil money penalty (CMP) authority in October 2023. Penalties became enforceable in October 2024. CMS now randomly audits 250 submissions each calendar quarter, imposing penalties of $1,000 per day for untimely reporting.
This represents a fundamental shift. What was once primarily a compliance obligation with limited enforcement has become an area where CMS actively monitors, audits, and penalizes non-compliance. Responsible Reporting Entities (RREs)—including insurance carriers, self-insureds, and third-party administrators—face real financial exposure for reporting failures.
3. New Reporting Requirements Taking Effect
April 4, 2025 marked a watershed moment for workers’ compensation settlements. CMS now mandates Section 111 reporting of Workers’ Compensation Medicare Set-Aside Arrangement (WCMSA) data for all settlements involving Medicare beneficiaries, including those with zero-dollar allocations and settlements below the $25,000 CMS review threshold.
This gives CMS unprecedented visibility into settlement practices. The agency now knows whether future medical allocations were included in low-dollar settlements and when no WCMSA was established. This data enables enhanced coordination of benefits and identifies potential compliance gaps.
How Medicare Secondary Payer Works
Medicare remains the primary payer for beneficiaries without other health insurance coverage. However, specific situations trigger secondary payer status:
Medicare pays primary when:
The beneficiary has no other insurance
The beneficiary has only Medicare Supplement (Medigap) insurance
The group health plan covering the beneficiary is from a small employer (fewer than 20 employees for working aged; fewer than 100 employees for disabled beneficiaries)
The 30-month coordination period for ESRD has ended and other coverage remains through employment
Medicare pays secondary when:
A beneficiary age 65 or older has group health plan coverage through current employment (their own or a spouse’s) with an employer of 20 or more employees
A disabled beneficiary under 65 has group health plan coverage through current employment (their own or a family member’s) with an employer of 100 or more employees
A beneficiary has ESRD and group health plan coverage during the first 30 months of Medicare eligibility
Payment has been made or can reasonably be expected from liability insurance, no-fault insurance, or workers’ compensation
The Five Main MSP Categories
1. Working Aged: Beneficiaries age 65 or older covered by a group health plan through current employment where the employer has 20 or more employees.
2. Disability: Beneficiaries entitled to Medicare based on disability who are covered under a group health plan through current employment where the employer has 100 or more employees.
3. End-Stage Renal Disease (ESRD): Beneficiaries with ESRD who have group health plan coverage during the 30-month coordination period following Medicare eligibility.
4. Liability Insurance (including self-insurance): Coverage that may be responsible for payment when a beneficiary’s medical condition results from an accident or alleged negligence of another party.
5. No-Fault Insurance and Workers’ Compensation: Coverage for medical expenses resulting from automobile accidents (no-fault) or work-related injuries or illnesses (workers’ compensation).
The Role of the Benefits Coordination & Recovery Center (BCRC)
The BCRC administers coordination of benefits for Medicare by maintaining the Common Working File (CWF), a CMS database that stores MSP data and investigation information. The BCRC collects data from multiple sources including IRS/SSA/CMS data matches, voluntary data sharing agreements with large employers, and mandatory Section 111 reporting from insurers.
When the BCRC identifies that another payer should be primary to Medicare, it posts an MSP occurrence to Medicare’s records. This information flows to Medicare Administrative Contractors (MACs) who use it to process claims correctly.
The BCRC also manages conditional payment recovery for non-group health plan situations. When Medicare pays conditionally for services that should have been covered by liability, no-fault, or workers’ compensation insurance, the BCRC seeks reimbursement after settlement, judgment, or award.
MSP Impact on Healthcare Operations
1. Cost Implications for Providers
MSP compliance affects the bottom line in several ways. First, claims submitted incorrectly as primary when Medicare should be secondary will be denied, creating rework and delaying payment. Clean claim rates drop when MSP information is missing or inaccurate.
Second, Medicare’s secondary payment amount is calculated based on the primary payer’s allowed amount and payment. If a provider has a favorable contract with the primary payer, Medicare’s secondary payment may be minimal. Understanding this calculation is essential for accurate revenue forecasting.
Third, conditional payments create recovery obligations. If Medicare pays conditionally and later determines another payer was responsible, Medicare seeks reimbursement. Providers who received the conditional payment may face recovery demands if they also collected from the primary payer.
2. Claims Processing and Revenue Cycle Effects
MSP adds complexity to every stage of the revenue cycle. Registration staff must collect comprehensive insurance information. Billing staff must verify which payer is primary before submitting claims. Claims must include specific MSP-related codes, condition codes, occurrence codes, and value codes to process correctly.
When Medicare is secondary, claims cannot be submitted until the primary payer has adjudicated the claim. The Explanation of Benefits (EOB) from the primary payer must accompany the Medicare claim. This sequential billing extends days in accounts receivable.
Electronic claims require proper loop and segment population for MSP information. Paper claims require specific form completion. Common billing errors include claims that don’t balance (when adjustment amounts don’t equal the total charge), missing value codes for auto/no-fault/workers’ compensation situations, and incorrect payer sequencing.
3. Compliance Requirements and Documentation Burden
Providers must make good faith efforts to determine whether Medicare is the primary or secondary payer. This requires asking beneficiaries specific questions about their insurance coverage during intake, admission, and at regular intervals for recurring services.
Documentation requirements are extensive. Providers must:
Ask MSP-related questions at each hospital admission and outpatient visit
Verify MSP information every 90 days for recurring outpatient services
Maintain records of insurance information collected
Keep documentation showing they asked the required questions, even when the beneficiary states nothing has changed
Retain records for at least three years after the service date
For workers’ compensation situations, providers must inquire whether the beneficiary is taking legal action and bill workers’ compensation first even when the claim is disputed, unless workers’ compensation will not pay promptly.
Common MSP Mistakes Healthcare Providers Make
1. Failing to Verify Insurance at Each Encounter
The most frequent MSP error is inadequate insurance verification. Many providers collect insurance information once and never update it. Employment status changes. Spouses retire. COBRA coverage ends. Each change potentially affects MSP status.
CMS requires verification at specific intervals:
Each inpatient hospital admission
Each hospital outpatient visit
Every 90 days for recurring outpatient services
Providers often misunderstand “recurring services.” These are identical services and treatments received on an outpatient basis more than once within a billing cycle. For such services, MSP information must be no older than 90 days from the service date.
2. Incomplete or Incorrect Claim Coding
MSP claims require specific coding elements. Missing or incorrect codes trigger denials. Common coding errors include:
Missing payer codes: Payer codes identify insurance coverage type. Each coverage category requires a specific payer code driven by the value codes reported on the claim.
Incorrect value codes: Value code 44 (other than accident-related) indicates the amount the provider agreed to accept from the primary payer as payment in full. Medicare uses this amount in its secondary payment calculation. Omitting VC 44 when applicable or using it incorrectly affects payment.
Missing Claim Adjustment Reason Codes (CARC): These codes explain why the primary payer’s paid amount differs from the billed amount. CMS requires CARC codes for all adjustments made by the primary payer.
Claims that don’t balance: MSP claims reject when primary claim adjustment amounts in the CAS segment plus the amount paid by the primary in the AMT segment don’t equal the total charge.
3. Not Understanding Conditional Payment Recovery
Many providers believe that once Medicare pays a claim, the transaction is complete. This is not true for MSP situations involving liability, no-fault, or workers’ compensation.
When Medicare makes a conditional payment—paying for services another payer may be responsible for—Medicare retains recovery rights. The payment is “conditional” because it must be repaid when a beneficiary receives a settlement, judgment, award, or other payment.
Providers sometimes collect from both Medicare (conditional payment) and the primary payer. Medicare then seeks recovery of the conditional payment. Understanding this recovery process is essential to avoid duplicate payments and subsequent recovery demands.
4. Missing the 90-Day Verification Window for Recurring Services
The 90-day verification requirement for recurring outpatient services is widely misunderstood. Providers often verify insurance at the start of a treatment series and assume this suffices for months of ongoing care.
When audited, CMS expects documentation showing MSP information was verified within 90 days of each service date for recurring services. “Verified” means asking the questions, not just confirming that insurance information looks the same in the system.
Providers should implement systematic prompts in their registration systems to trigger re-verification at appropriate intervals. Documentation should explicitly note that MSP questions were asked and record the beneficiary’s responses or statement that nothing has changed.
Group Health Plans vs. Non-Group Health Plans: Understanding the Difference
1. GHP Rules for Working Aged and ESRD Patients
Group Health Plans operate under specific size thresholds. For working aged beneficiaries (65 or older), the employer must have 20 or more employees for the GHP to be primary. For disabled beneficiaries under 65, the employer must have 100 or more employees.
These thresholds apply per employer, not per plan. All common law employees count, including part-time employees, regardless of whether they’re enrolled in the GHP. Separate legal entities under common ownership may be aggregated when determining size.
ESRD presents unique rules. During the first 30 months of Medicare eligibility based on ESRD, group health plan coverage through current employment remains primary. After 30 months, Medicare becomes primary. This is called the “30-month coordination period.”
If the beneficiary has ESRD and also qualifies for Medicare based on age or disability, separate rules apply depending on which entitlement came first. Providers should consult CMS guidance for these dual entitlement scenarios.
2. NGHP Coverage: Liability, No-Fault, and Workers’ Compensation
Non-Group Health Plans include liability insurance (including self-insurance), no-fault insurance, and workers’ compensation. These coverages typically arise from unexpected incidents: car accidents, work-related injuries, or injuries caused by another party’s negligence.
When an NGHP situation exists, Medicare will not pay for injury-related care if payment has been made or can reasonably be expected from the NGHP. If the NGHP insurer will not pay promptly—or if responsibility is disputed—Medicare may make conditional payments to ensure the beneficiary has access to care.
Providers must bill the NGHP first. Only after receiving the NGHP’s denial or if the NGHP will not pay promptly may the provider submit a conditional payment request to Medicare. This requires specific documentation explaining why the primary payer did not pay.
MSP Conditional Payments and Recovery Process
A conditional payment is a payment Medicare makes for services another payer may be responsible for. Medicare makes conditional payments so beneficiaries do not have to use their own money to pay medical bills while determining liability or waiting for settlements.
The payment is “conditional” because it must be repaid to Medicare when a settlement, judgment, award, or other payment is made. Medicare’s recovery rights are established by federal statute (42 U.S.C. § 1395y(b)) and override state laws and private contracts.
Conditional payments most commonly occur in liability, no-fault, and workers’ compensation situations. When a beneficiary is injured in a car accident or at work, medical care begins immediately. Determining who will ultimately pay may take months or years while liability is investigated and claims are negotiated. Medicare pays conditionally to ensure the beneficiary receives necessary care.
A. How the Recovery Process Works
The conditional payment recovery process follows several stages:
1. Reporting the case: When a liability, no-fault, or workers’ compensation case exists, it must be reported to the BCRC. This can be done by the beneficiary, their attorney, the insurer, or a provider aware of the situation. Reporting triggers the BCRC’s investigation.
2. BCRC investigation: The BCRC collects information from multiple sources including claims processors, Section 111 mandatory insurer reporting, and workers’ compensation entities. The BCRC identifies any conditional payments Medicare made that relate to the injury or illness.
3. Conditional Payment Letter (CPL) or Conditional Payment Notice (CPN): The BCRC sends a letter listing the conditional payments Medicare made and their total amount. This letter provides 30 calendar days to respond.
4. Dispute process: If the beneficiary or their representative believes certain claims should not be included, they must submit documentation supporting that position. The BCRC reviews disputes and adjusts the conditional payment amount if it agrees the claims are unrelated. This review takes up to 45 days.
5. Final demand: Once disputes are resolved and a settlement occurs, the BCRC issues a final demand letter specifying the repayment amount. This amount must be paid from the settlement proceeds.
6. Payment: Payment can be made via pay.gov using ACH, debit card, or PayPal. Failure to repay Medicare’s conditional payments can result in the debt being referred to the Department of Treasury for collection.
B. Using the Medicare Secondary Payer Recovery Portal (MSPRP)
The MSPRP is a web-based tool that allows attorneys, insurers, beneficiaries, and recovery agents to manage MSP recovery cases online. The portal provides several capabilities:
Viewing conditional payment amounts in real time
Submitting proof of representation and consent to release documentation
Initiating demand letters earlier than the default 30-day period
Disputing individual claims included in the conditional payment amount
Requesting access to unmasked claims data
Making electronic payments
Tracking correspondence and case status
Registration is required before accessing the MSPRP. Users must complete identity proofing and multi-factor authentication to request access to unmasked claims data.
The MSPRP significantly accelerates the resolution process. Before the portal, everything occurred via mail and fax with extensive delays. The portal allows real-time updates and substantially reduces resolution timelines.
C. Timeline and Appeal Rights
The recovery process has defined timelines. After receiving a conditional payment letter or notice, parties have 30 days to respond. If no response is received, the BCRC may issue a demand letter.
After a demand letter is issued, beneficiaries have appeal rights. The first level of appeal is a redetermination. Redetermination requests must be filed within 120 days of receiving the demand letter. The redetermination officer reviews the case and issues a decision.
If the redetermination is unfavorable, subsequent appeal levels include reconsideration by a Qualified Independent Contractor (QIC), Administrative Law Judge hearing, Medicare Appeals Council review, and judicial review in federal district court.
Waivers of recovery are available in limited circumstances. Beneficiaries may request a waiver if recovering the conditional payment would cause financial hardship or if they were not at fault in creating the overpayment situation. Waiver requests cannot be processed until after a recovery demand letter is issued.
Old Way vs. Modern Approach to MSP Compliance
Old Way:
Passive insurance verification at admission only
Manual paper-based claims submission with minimal MSP coding
Reactive response to Medicare denials and recovery demands
Limited understanding of conditional payment obligations
Minimal technology support beyond basic claims systems
Siloed compliance efforts without cross-functional coordination
Treating MSP as a billing issue rather than an enterprise risk
Modern Approach:
Systematic verification at every encounter with automated prompts
Electronic claims with comprehensive MSP data elements and validation edits
Proactive identification of MSP situations before claims submission
Clear recovery process workflows with designated staff responsibilities
Integrated technology platforms connecting eligibility, claims, and compliance functions
Cross-functional compliance teams involving revenue cycle, compliance, legal, and clinical leadership
Enterprise risk management framework treating MSP as a financial and regulatory exposure requiring board-level attention
The modern approach recognizes that MSP compliance cannot be relegated to billing staff. It requires organizational commitment, technology investment, and systematic processes spanning registration through final payment resolution.
Leading organizations implement real-time eligibility checking that queries CMS systems to identify MSP indicators before services are rendered. They use automated claim scrubbing that validates MSP coding requirements before submission. They establish dedicated conditional payment coordinators who manage recovery cases and interface with the BCRC.
Most importantly, they treat MSP compliance as a strategic priority rather than an operational nuisance. Executive dashboards track MSP-related denials, recovery demands, and compliance metrics. Compliance committees review MSP performance quarterly. Leadership allocates resources to technology and training that prevent errors upstream rather than fixing them downstream.
The Next 12-36 Months: What Healthcare Leaders Should Expect
1. Enhanced CMS Monitoring and Auditing
CMS’s enforcement posture will continue strengthening. The civil money penalty framework established in 2023-2024 represents the beginning of enhanced enforcement, not its conclusion.
Expect expanded audit activity. CMS currently audits 250 quarterly submissions (1,000 annually). This may increase as CMS gains confidence in its audit processes and as agency resources grow.
Expect data analytics to drive audit selection. CMS now has unprecedented data through Section 111 reporting, including WCMSA information. The agency will identify statistical outliers—RREs with unusual reporting patterns, late submissions, or zero-dollar MSAs in circumstances suggesting underfunding. These outliers will receive closer scrutiny.
Expect False Claims Act activity to increase. The Department of Justice has shown interest in MSP non-compliance as a potential False Claims Act theory. Failure to properly identify and bill primary payers before Medicare may constitute false claims. Qui tam relators (whistleblowers) are increasingly focusing on MSP-related issues.
Healthcare leaders should prepare for this enhanced environment by establishing robust compliance programs, conducting internal audits to identify gaps, and remediating issues proactively before they become enforcement targets.
2. Technology Solutions Gaining Traction
Technology vendors are developing increasingly sophisticated MSP compliance solutions. These tools integrate with core systems to provide:
Real-time eligibility verification: Automated queries to CMS Coordination of Benefits databases during registration, surfacing MSP indicators immediately so registration staff can collect proper insurance information.
Rules-based claim validation: Pre-submission validation that checks claims for required MSP data elements, verifies coding logic, and flags potential errors before claims leave the organization.
Predictive analytics: Machine learning models that identify high-risk claims likely to generate MSP-related denials based on historical patterns.
Workflow automation: Automated routing of MSP-related tasks to appropriate staff, deadline tracking for conditional payment responses, and systematic follow-up on pending issues.
Reporting and analytics: Dashboards providing visibility into MSP denial rates, recovery demand volumes, compliance metrics, and financial impact.
Organizations should evaluate these solutions based on integration capabilities with existing systems, vendor expertise in MSP compliance, implementation support, and total cost of ownership. The right technology can significantly reduce manual effort while improving accuracy and compliance.
3. Policy Evolution and Regulatory Clarity
CMS will likely continue refining MSP guidance. The WCMSA Reference Guide has undergone multiple revisions in 2025 alone. The Section 111 User Guide updates regularly. This pattern will persist as CMS responds to industry feedback and emerging compliance issues.
Legislative activity may occur. Congressional interest in Medicare solvency creates potential for MSP-related legislation. Possible areas include:
Standardization of WCMSA thresholds and processes
Expansion of mandatory reporting beyond current requirements
Enhanced CMS audit authority and penalties
Private right of action provisions allowing Medicare beneficiaries to sue for MSP violations
Healthcare leaders should monitor regulatory developments through industry associations, CMS updates, and legal counsel. Participating in comment periods when CMS proposes rule changes allows organizations to shape policy and prepare for implementation.
The trajectory is clear: MSP compliance requirements will become more detailed, enforcement will intensify, and technology will play an increasingly central role. Organizations that prepare now will manage this transition more effectively than those waiting for problems to emerge.
Practical Takeaways for U.S. Healthcare Leaders
1. Treat MSP as an enterprise risk, not a billing issue. MSP compliance requires executive attention, cross-functional coordination, and board-level oversight. Financial exposure from penalties, recovery demands, and denied claims can be substantial.
2. Implement systematic verification processes at every encounter. One-time insurance collection at admission is insufficient. Build verification prompts into registration workflows at each service date and every 90 days for recurring services. Document that questions were asked and record responses.
3. Invest in technology that prevents errors upstream. Real-time eligibility checking, automated claim validation, and workflow management tools reduce manual effort while improving accuracy. The ROI from reduced denials and faster payment typically justifies technology investments.
4. Establish clear accountability for conditional payment management. Designate specific staff responsible for monitoring conditional payment notifications, responding to BCRC inquiries, managing disputes, and coordinating with legal counsel when necessary. These responsibilities cannot be “additional duties as assigned” for already-overloaded billing staff.
5. Conduct regular internal audits of MSP compliance. Review claims data to identify MSP-related denials, analyze root causes, and implement corrective actions. Audit documentation of insurance verification to ensure processes are being followed. Identify training needs and address gaps proactively.
6. Develop relationships with specialized MSP counsel. Complex MSP situations—particularly involving conditional payments, WCMSAs, and Section 111 reporting—require specialized legal expertise. Establish relationships with attorneys experienced in MSP compliance before problems arise.
7. Monitor regulatory developments and participate in policy discussions. CMS guidance evolves continuously. Subscribe to CMS listservs, participate in industry associations, and allocate staff time to staying current with changes. When opportunities arise to comment on proposed rules, provide input based on operational experience.
Medicare Advantage has crossed a watershed moment: more than half of all eligible Medicare beneficiaries 54% as of 2025 now receive their coverage through private insurance plans rather than traditional Medicare. This represents 34.1 million people out of approximately 62.8 million Medicare beneficiaries with Parts A and B, and the Congressional Budget Office projects this will climb to 64% by 2034.
For healthcare executives, health system leaders, and policy-aware operators, this shift isn’t just a market trend; it’s a fundamental restructuring of how Medicare operates, how revenue flows through the system, and how care gets delivered. Understanding Medicare Advantage’s mechanics, financial implications, and operational realities has become essential to strategic planning in U.S. healthcare.
What Is Medicare Advantage?
Medicare Advantage (MA), also known as Medicare Part C, is an alternative to traditional fee-for-service Medicare. Instead of the federal government paying providers directly for each service rendered, Medicare pays private insurance companies a fixed monthly amount per enrollee. These MA organizations (MAOs) then assume responsibility for providing all Medicare-covered benefits and often add supplemental benefits not available in traditional Medicare.
Traditional Medicare operates as a single-payer, fee-for-service system. Beneficiaries can see any provider who accepts Medicare, pay standardized cost-sharing (20% coinsurance for Part B services, no out-of-pocket maximum), and receive coverage for Medicare-defined services only. Medicare Advantage, by contrast, operates through managed care structures typically HMOs, PPOs, or Private Fee-for-Service plans with provider networks, prior authorization requirements, and the ability to negotiate rates with providers.
How the Payment Model Works
Medicare pays MA plans through a risk-adjusted capitation model. CMS calculates a “benchmark” for each county based on traditional Medicare spending in that area, adjusted for factors including:
County-level fee-for-service costs
Quality bonus payments (Star Ratings)
Demographic characteristics
Risk scores reflecting enrollee health status
Plans submit bids indicating what they believe it will cost to provide Medicare-covered benefits. If a plan’s bid comes in below the benchmark, the plan receives a rebate—a percentage of the difference—which must be used to provide additional benefits, reduce premiums, or lower cost-sharing. In 2024, benchmarks averaged 108% of traditional Medicare spending before accounting for coding intensity or favorable selection. Bids averaged 82% of traditional Medicare spending. After rebates, payments reached approximately 100% of traditional Medicare spending—before adjusting for the two factors that drive overpayment concerns: coding intensity and favorable selection.
Why Medicare Advantage’s Growth Matters Now
Medicare Advantage enrollment grew by 1.3 million beneficiaries between 2024 and 2025, a 4% increase. While this growth rate has decelerated from the 7% increase seen the prior year, the absolute numbers remain substantial. The program is projected to cost taxpayers $507 billion in 2026.
UnitedHealth Group dominates the market with 29% of all MA enrollment in 2025, up from 18% in 2010. Combined with Humana at 17%, these two organizations control 46% of the entire Medicare Advantage market. Behind them, Elevance Health, CVS (Aetna), and Blue Cross Blue Shield plans round out the top tier, while market concentration continues to increase.
Special Needs Plans—designed for dual-eligible beneficiaries, those with chronic conditions, or those requiring institutional-level care—are driving disproportionate growth. SNPs captured 48% of the total enrollment increase between 2024 and 2025, despite representing only 21% of total MA enrollment. Within this segment, Dual-Eligible SNPs (D-SNPs) account for 83% of SNP enrollment, reflecting both the program’s appeal to vulnerable populations and plans’ strategic focus on high-margin segments.
Financial Implications for the Medicare Program
The Medicare Payment Advisory Commission estimates that Medicare Advantage plans will be overpaid by $76 billion in 2026 compared to what the government would spend if those same beneficiaries remained in traditional Medicare. The Committee for a Responsible Federal Budget projects this could total $1.2 trillion over the next decade if current trends continue.
This overpayment stems from two primary mechanisms. First, coding intensity: MA plans document more diagnoses per beneficiary than traditional Medicare physicians, making enrollees appear sicker and increasing risk-adjusted payments. Although CMS reduces MA payments by the statutory minimum of 5.9% to adjust for coding intensity, MedPAC estimates the actual effect is closer to 10-14% higher payments. Second, favorable selection: MA enrollees tend to be healthier than traditional Medicare beneficiaries with similar risk scores. MedPAC estimates this adds 11% to MA costs compared to traditional Medicare, totaling approximately $57 billion in overpayments in 2026.
Of the projected $1.2 trillion in overpayments through 2035, approximately $520 billion will come from the Medicare Hospital Insurance trust fund—nearly as large as the entire HI trust fund deficit. Beneficiaries will pay an additional $220 billion in premiums as a result of these overpayments.
How Medicare Advantage Actually Operates
Medicare pays MA plans based on enrollee risk scores generated through CMS’s Hierarchical Condition Category (HCC) model. This model assigns each beneficiary a risk score based on demographic factors (age, sex, disability status, Medicaid eligibility) and diagnosed medical conditions from the previous year. Higher risk scores generate higher monthly payments.
The fundamental challenge: traditional Medicare doesn’t use diagnosis codes to determine payment. Providers billing fee-for-service Medicare have no financial incentive to document every condition. MA plans, however, directly benefit from comprehensive diagnosis coding—creating what critics call “upcoding” and what the industry defends as “appropriate clinical documentation.”
A 2024 Wall Street Journal investigation revealed that MA plans diagnosed approximately 18,000 enrollees with HIV between 2018 and 2021, but these individuals weren’t receiving HIV treatment from physicians. In many cases, these diagnoses appeared to be added without physician knowledge, raising questions about the accuracy and appropriateness of MA coding practices.
CMS has implemented a new risk adjustment model being phased in over three years (starting at 33% in 2024, increasing to 52% in 2025) to address some coding disparities. This represents a technical adjustment related to medical education costs in the growth rates, but the fundamental incentive structure remains unchanged.
Special Needs Plans and Market Segmentation
Special Needs Plans have become the fastest-growing segment within Medicare Advantage, with enrollment increasing 10% from 2024 to 2025—though this represents a deceleration from the 17% average annual growth rate over the previous five years. SNPs now account for more than one in five MA enrollees.
D-SNPs, which serve beneficiaries eligible for both Medicare and Medicaid, dominate with 83% of SNP enrollment. These plans coordinate benefits across both programs and often provide enhanced care management. However, MedPAC’s analysis excludes the care coordination costs D-SNPs incur when comparing spending to traditional Medicare, potentially overstating the overpayment estimate for this segment.
Chronic Condition SNPs (C-SNPs) saw explosive growth of over 70% between 2024 and 2025, compared to just 3% for D-SNPs and flat growth for institutional SNPs. This reflects both genuine innovation in managing specific chronic conditions and the financial attractiveness of higher risk-adjusted payments for these populations.
Supplemental Benefits as a Competitive Weapon
MA plans use supplemental benefits—services not covered by traditional Medicare—as their primary competitive differentiator. In 2024, 97% of plans offered dental coverage, making it essentially mandatory. More than 86% offered $0 primary care provider copays, recognizing that strong PCP relationships drive better outcomes, lower medical costs, improved Star ratings, and more accurate risk adjustment.
Part B premium buyback plans have increased in prevalence, directly reducing enrollees’ out-of-pocket Medicare premiums. Over-the-counter drug coverage reached 85% of plans, while $0 Part D deductibles appeared in 66% of plans. However, for the first time in years, growth in several supplemental benefits stabilized rather than expanded from 2023 to 2024, reflecting the financial headwinds MA plans faced entering the 2025 bid cycle.
Average value-added benefits (combining Part C medical benefits, Part D drug benefits, and premium reductions) grew approximately $20 per member per month annually from 2021 to 2023, but increased by less than $3 from 2023 to 2024. This deceleration signals a market inflection point where plans are prioritizing margin protection over benefit richness.
Impact on Cost: The $76 Billion Overpayment Question
MedPAC’s methodology compares spending on beneficiaries who switch from traditional Medicare to MA with spending on similar beneficiaries who remain in traditional Medicare. Using data from Medicare “switchers,” MedPAC estimates that MA payments in 2026 will be 22% higher than traditional Medicare would spend for the same population.
Approximately $22 billion of the projected $76 billion in 2026 overpayments stems from coding intensity. MA plans document significantly more diagnoses per beneficiary than traditional Medicare providers, even when the underlying health status appears similar. This isn’t necessarily fraudulent—many MA plans argue they’re simply capturing conditions that exist but weren’t previously documented—but it creates a fundamental payment asymmetry.
The challenge for policymakers: distinguishing between legitimate clinical documentation improvement and aggressive upcoding designed to inflate payments. CMS’s statutory 5.9% coding intensity adjustment has proven insufficient, but determining the “correct” adjustment percentage remains contentious.
Favorable Selection and Healthier Populations
Favorable selection accounts for approximately $57 billion in overpayments in 2026. Despite similar risk scores, MA enrollees consistently spend less on healthcare than traditional Medicare beneficiaries, suggesting they’re healthier than their risk scores indicate.
Several mechanisms drive favorable selection. Prior authorization requirements and narrower provider networks may discourage sicker beneficiaries from enrolling or may reduce utilization once enrolled. MA plans also invest heavily in targeted marketing toward healthier populations and design benefits to attract lower-cost enrollees—for example, gym memberships appeal to relatively healthy seniors while doing little for frail, homebound beneficiaries.
MedPAC’s analysis adjusts for measurable health differences, but critics argue the methodology can’t fully capture the complexity of who chooses MA versus traditional Medicare. More than 40% of MA enrollees join MA plans directly upon Medicare eligibility, bypassing traditional Medicare entirely. If these direct-to-MA enrollees have different cost patterns than the “switchers” MedPAC studies, the overpayment estimates could be either too high or too low.
The Industry Pushback
The MA industry vigorously disputes MedPAC’s overpayment estimates. The Better Medicare Alliance, America’s Health Insurance Plans (AHIP), and the Healthcare Leadership Council have all published analyses challenging MedPAC’s methodology.
Industry arguments focus on three main points. First, MA provides additional value—care coordination, disease management programs, 24/7 nurse hotlines, and wellness benefits—that traditional Medicare doesn’t offer. Comparing costs without accounting for this additional value creates an incomplete picture.
Second, MedPAC’s reliance on “switcher” data creates a biased sample that doesn’t represent the full MA population, particularly the growing share who join MA directly upon eligibility. Third, D-SNPs incur significant care coordination costs mandated by CMS that traditional Medicare doesn’t provide, making direct cost comparisons misleading.
However, these industry critiques don’t directly rebut MedPAC’s core finding: the federal government pays MA plans substantially more than it would pay traditional Medicare for clinically similar beneficiaries. Whether that additional payment purchases sufficient additional value for beneficiaries and taxpayers remains the central policy debate.
Impact on Patient Outcomes and Access
Prior Authorization: 50 Million Requests Annually
Medicare Advantage insurers processed nearly 50 million prior authorization determinations in 2023, averaging 1.8 requests per enrollee. This represents a steady increase from 37 million requests in 2021 as MA enrollment has grown. By comparison, traditional Medicare processed fewer than 400,000 prior authorization reviews in fiscal year 2023—about 0.01 per beneficiary—reflecting traditional Medicare’s limited use of prior authorization for only a narrow set of services like certain durable medical equipment and home health services.
An AMA survey found that practices complete an average of 39 prior authorization requests per physician per week. For physician groups treating substantial numbers of MA patients, this administrative burden is significant. 94% of physicians reported that prior authorization leads to delays in patients accessing necessary care, and 24% reported that prior authorization has led to a serious adverse event for a patient in their care.
The sheer volume creates friction in the healthcare delivery system, even when requests are ultimately approved. Providers must staff dedicated personnel to manage prior authorization, track submissions, follow up on pending requests, and handle appeals—costs that don’t exist in traditional Medicare’s simpler administrative model.
Denial Rates and the Appeal Reality
In 2023, MA plans denied 6.4% of all prior authorization requests—3.2 million denials. While this represents a decrease from the 7.4% denial rate in 2022, it still means millions of provider-ordered services require additional steps before proceeding.
Denial rates vary substantially across insurers. In 2023, Centene denied 13.6% of prior authorization requests while Anthem denied just 4.2%. CVS Health denied 11%, Humana denied 3.5%, and UnitedHealthcare denied 5.9%. These differences reflect varying approaches to medical necessity determination, network management strategies, and benefit design.
Only 11.7% of denied prior authorization requests were appealed in 2023. This low appeal rate likely reflects multiple factors: beneficiaries may not understand their appeal rights, may lack the time or capacity to navigate the appeals process, or may simply pay out-of-pocket or forego the service rather than fight the denial.
However, among denials that were appealed, 81.7% were fully or partially overturned in 2023. This high overturn rate is striking and troubling. It suggests either that MA plans are inappropriately denying care that clearly meets medical necessity standards, or that only the strongest cases proceed to appeal while weaker cases are abandoned. An HHS Office of Inspector General review found that 13% of prior authorization denials by MA plans would have been approved under traditional Medicare coverage rules, and 18% of payment denials met both Medicare coverage rules and MA billing rules yet were still denied.
Post-Acute Care Access Restrictions
A 2024 Senate Permanent Subcommittee on Investigations report found that MA plans deny prior authorization requests for post-acute care at dramatically higher rates than their overall denial rates. In 2022, UnitedHealthcare and CVS denied post-acute care requests at approximately three times their overall denial rates, while Humana’s post-acute care denial rate was more than 16 times higher than its overall denial rate.
This creates particular challenges for hospitals discharging Medicare Advantage patients who need skilled nursing, inpatient rehabilitation, or long-term acute care. Discharge planning teams must navigate plan-specific criteria, obtain prior authorization before transfer, and manage denials that delay transitions of care. When MA plans deny post-acute care that traditional Medicare would cover, hospitals face pressure to keep patients in acute beds longer than medically necessary or to discharge patients without adequate follow-up care.
Examples from the OIG review included MA plans requiring X-rays before approving more advanced imaging like MRIs, and using clinical criteria not contained in Medicare coverage rules to deny services that would have been covered in traditional Medicare. These denials potentially delay necessary diagnoses and treatment, particularly for time-sensitive conditions.
Impact on Healthcare Compliance and Operations
Star Ratings Pressure and Quality Bonuses
CMS’s Five-Star Quality Rating System drives substantial financial stakes. Plans achieving 4 stars or higher receive quality bonus payments that increase their benchmarks, allowing higher bids or more generous benefits. In 2024, quality bonuses totaled at least $12.8 billion.
However, Star ratings have been declining. In 2024, only 31 plans earned 5 stars, down from 57 in 2023 and 74 in 2022. The average Star rating fell from 4.14 in 2023 to 4.04 in 2024 when weighted by membership. Kaiser Permanente, historically a 5-star plan, dropped to 4 stars. This widespread decline reflects both increased performance pressure and changes to the rating methodology that have made high ratings harder to achieve.
MedPAC has criticized the Star rating system as “not a good basis for judging quality,” noting that the measures don’t necessarily correlate with better patient outcomes and that the quality bonus payments contribute to overpayments without clear evidence of proportional quality improvement. Nevertheless, the Star rating system remains central to MA plan operations, driving investments in member engagement, medication adherence programs, and health assessments designed to improve measured performance.
Plans dedicate substantial resources to maximizing Star ratings. This includes member outreach campaigns to complete Health Risk Assessments, medication adherence programs targeting Star-measured drugs, care management interventions for members with care gaps, and strategic provider contracting based on quality performance. These activities may genuinely improve care, but they’re fundamentally motivated by financial incentives rather than pure clinical necessity.
Broker Compensation Changes
CMS attempted to standardize and tighten broker commission limits in the 2025 MA final rule to reduce steering of beneficiaries toward plans that pay higher commissions rather than plans that best meet beneficiaries’ needs. This rule faced legal challenges and implementation has been delayed, but the underlying issue remains: broker incentives don’t always align with beneficiary interests.
In response to ongoing margin pressure, many MA plans have begun reducing or eliminating commissions on new products that may be unprofitable. Plans retain these products to avoid disrupting existing membership, but they don’t pay brokers to actively sell them to new enrollees. This creates a de facto tiering of products: heavily commissioned plans that brokers actively market versus low-commission or zero-commission plans that beneficiaries must proactively seek out.
For health systems with provider-sponsored health plans (PSHPs), this dynamic creates competitive disadvantages. PSHPs, which are predominantly nonprofit plans aligned with health systems, captured only a small fraction of 2024’s MA growth despite theoretical advantages in plan-provider integration. Research shows that 62% of primary care physicians recommend specific health plan products to their patients, and approximately half of patients follow that advice. Yet PSHPs continue to lose market share, suggesting that broker incentives and marketing budgets matter more than physician recommendations in driving enrollment decisions.
Network Adequacy Requirements
CMS’s 2024 final rule strengthened network adequacy standards and transparency requirements. Plans must demonstrate adequate provider networks before the start of the plan year and maintain updated provider directories that accurately reflect which providers are accepting new patients.
This creates both compliance obligations and strategic considerations. MA plans must contract with sufficient specialists in each required category, maintain adequate geographic distribution, and ensure appointment wait times meet CMS standards. However, plans also benefit from selectively narrow networks that channel members toward high-performing, cost-effective providers.
The tension between network breadth and managed care discipline remains central to MA operations. Broader networks may attract more enrollees and reduce access complaints, but they dilute the plan’s ability to steer utilization and negotiate favorable rates. Narrower networks enable tighter cost management but risk beneficiary complaints, network adequacy violations, and Star rating penalties for member experience measures.
For providers, MA network participation has become essential as MA penetration exceeds 50%. Being out-of-network for major MA plans increasingly means being effectively inaccessible to more than half of Medicare beneficiaries in many markets. This gives MA plans substantial negotiating leverage, particularly in less competitive markets where one or two plans dominate.
Common Misconceptions About Medicare Advantage
“MA Is Always Cheaper for the Government”
This is demonstrably false based on current payment structures. MedPAC’s analysis shows Medicare pays MA plans 22% more than it would spend covering the same beneficiaries in traditional Medicare. The Congressional Budget Office projects this will cost taxpayers an additional $1.2 trillion through 2035.
The misconception stems from MA’s origins in the 1990s when the program was sold as a way to harness private sector efficiency to reduce Medicare costs. In practice, payment policies—including quality bonuses, risk adjustment, and insufficient coding intensity adjustments—have created a system where MA costs more, not less.
MA industry advocates argue that cost comparisons should account for additional value: out-of-pocket limits, supplemental benefits, care coordination, and disease management programs that traditional Medicare doesn’t provide. This is a reasonable point for evaluating overall value, but it doesn’t change the underlying cost reality: MA currently costs the federal government substantially more per beneficiary than traditional Medicare.
“MA Plans Have Better Quality”
The evidence is mixed and often contradictory. MA plans point to their Star ratings, supplemental benefits, and care coordination programs as evidence of superior quality. However, MedPAC notes that the Star rating system doesn’t reliably measure clinical outcomes and is susceptible to gaming through selective enrollment and aggressive member engagement campaigns.
Studies comparing MA to traditional Medicare outcomes show inconsistent results. Some research finds MA enrollees receive more preventive care and have better medication adherence. Other studies find no significant differences in mortality, hospital readmissions, or emergency department use. The HHS Office of Inspector General’s finding that 13% of MA prior authorization denials would have been approved under traditional Medicare raises concerns about access to medically necessary care.
The quality debate often conflates different dimensions: access to supplemental benefits versus access to medically necessary services, process measures versus health outcomes, and member satisfaction versus clinical effectiveness. MA likely performs better on some dimensions (financial protection through out-of-pocket limits, access to dental and vision care) while potentially performing worse on others (prior authorization barriers to specialty care, restricted access to post-acute services, narrow networks limiting provider choice).
“Prior Authorization Only Affects a Small Number of Services”
99% of Medicare Advantage enrollees are in plans with prior authorization requirements for at least some services. MA plans processed 50 million prior authorization determinations in 2023—an average of 1.8 per enrollee. For context, traditional Medicare processed only 400,000 prior authorization reviews for its entire population of approximately 29 million beneficiaries.
While not every enrollee personally experiences a prior authorization delay or denial, the system’s pervasiveness affects care delivery broadly. Physicians spend an average of 13 hours per week on prior authorization across all payers. This doesn’t include just the minority of patients facing denials—it includes every request submitted, whether ultimately approved or denied.
The impact extends beyond the headline denial rate. Even approved prior authorizations create delays while awaiting determination, impose administrative costs on providers, and introduce friction into the care delivery process. The 81.7% overturn rate on appeals suggests that many denials were questionable from the outset, meaning patients and providers expended time and effort navigating appeals for services that were always medically necessary.
Traditional Medicare vs. Medicare Advantage: The 2026 Reality
Nationwide: Any provider in the U.S. accepting Medicare.
Restricted: Limited to HMO, PPO, or PFFS networks.
Prior Authorization
Generally not required for most services.
Required for many services (99% of plans).
Out-of-Pocket Max
None. No cap on Part A and B spending.
Mandatory Cap: Max $9,350 (2025) for in-network.
Cost Sharing
Standardized (e.g., 20% coinsurance for Part B).
Varies by plan; often lower copays for primary care.
Drug Coverage
Requires separate Part D plan.
Usually integrated into the plan.
Extra Benefits
None (no dental, vision, or hearing).
Includes dental, vision, hearing, gyms, and OTC.
Medigap Eligibility
Yes: Can buy supplemental insurance.
No: Prohibited by law.
Premiums
Part B premium ($185/mo in 2026) + Part D/Medigap.
Often $0 (beyond the standard Part B premium).
Administrative Ease
High (simple billing, no network hurdles).
Lower (requires managing networks and approvals).
Cost Structure Comparison
For beneficiaries, MA often appears less expensive. 75% of enrollees in individual MA plans pay no premium beyond the standard Medicare Part B premium ($185 per month in 2026). Average out-of-pocket limits in MA plans were $4,882 for in-network services in 2024. Traditional Medicare has no Part A and B out-of-pocket limit, making it potentially catastrophic for high utilizers who don’t purchase supplemental Medigap coverage.
However, this favorable cost structure for enrollees comes at taxpayer expense. The federal government pays MA plans an average of 22% more per beneficiary than traditional Medicare would cost. This subsidy enables MA plans to offer generous benefits at low or zero premiums, but it increases overall Medicare program costs and accelerates Medicare Hospital Insurance trust fund insolvency.
For providers, the cost equation differs. Traditional Medicare pays predictable, transparent rates set by CMS fee schedules. MA plans negotiate rates individually, often paying below Medicare rates in competitive markets, and impose prior authorization and other administrative requirements that increase provider costs. Some providers, particularly in specialties facing high prior authorization burdens, are choosing to opt out of MA networks despite the loss of access to more than half of Medicare beneficiaries in many markets.
Access and Administrative Burden
Traditional Medicare offers essentially unlimited access: beneficiaries can see any provider accepting Medicare anywhere in the country without prior authorization or network restrictions. This matters particularly for beneficiaries who winter in different states, travel frequently, or need specialty care at major academic medical centers.
MA access depends on networks and prior authorization. Beneficiaries must generally use in-network providers (except in emergencies) and obtain prior authorization for many services. Out-of-area coverage is typically limited to emergencies and urgently needed care. This creates challenges for beneficiaries with complex conditions requiring subspecialty expertise, particularly when the best providers are out-of-network or located outside the plan’s service area.
Administrative burden falls differently on the two systems. For beneficiaries, traditional Medicare is administratively simple: show your Medicare card, pay your cost-sharing, traditional Medicare handles the rest. MA requires understanding network restrictions, obtaining prior authorizations, and potentially appealing denials.
For providers, traditional Medicare involves straightforward billing against published fee schedules. MA involves negotiating contracts with multiple plans, learning each plan’s prior authorization requirements, tracking network status, and managing denials and appeals. The AMA estimates physicians complete 39 prior authorization requests per week—much of this driven by MA and commercial insurance rather than traditional Medicare.
The Next 12–36 Months: What’s Coming
CBO Projects 64% Penetration by 2034
If current trends continue, nearly two-thirds of Medicare beneficiaries will be enrolled in MA plans within a decade. This represents a fundamental transformation of Medicare from a primarily public program into a predominantly privatized system operating through managed care.
However, several factors could slow or reverse this growth trajectory. Payment pressures are mounting: CMS is phasing in risk adjustment model changes that reduce overpayments, MedPAC is advocating for more aggressive coding intensity adjustments, and bipartisan congressional scrutiny of MA overpayments is increasing. If payment rates decline meaningfully, plans may reduce benefit generosity, exit less profitable markets, or restrict enrollment—all of which could dampen growth.
Demographic factors continue favoring MA growth. Approximately 10,000 baby boomers turn 65 daily, a pattern that will continue through 2030. More than 40% of new Medicare eligibles now join MA directly rather than starting in traditional Medicare, suggesting generational acceptance of managed care that wasn’t present in earlier cohorts. This direct-to-MA enrollment pattern, if it continues, will sustain growth even if switching from traditional Medicare to MA slows.
Regulatory Pressure on Overpayments
Multiple federal bodies are now focused on MA overpayments. MedPAC publishes annual overpayment estimates and advocates for payment reforms. The HHS Office of Inspector General conducts audits of MA plan practices and recommends policy changes. Congressional committees particularly the Senate Permanent Subcommittee on Investigations have held hearings and published reports documenting inappropriate denials and excessive coding.
The political dynamics are complex. MA enjoys strong beneficiary satisfaction enrollees appreciate low premiums, out-of-pocket limits, and supplemental benefits. This creates political resistance to major payment cuts that might reduce benefit generosity. However, fiscal pressures are mounting. The Medicare Hospital Insurance trust fund faces insolvency projections, and MA overpayments represent a significant contributor. The Committee for a Responsible Federal Budget estimates that MA overpayments will extract $520 billion from the HI trust fund through 2035.
Potential regulatory changes include:
More aggressive coding intensity adjustments above the current 5.9% statutory minimum
Reformed risk adjustment models that better account for favorable selection
Restrictions on supplemental benefits that primarily attract healthy enrollees
Enhanced prior authorization oversight and denial reporting requirements
Reduced or reformed quality bonus payments
Benchmark adjustments in overpaid counties
Market Consolidation Among Top Payers
Market concentration continues increasing. UnitedHealth Group, Humana, and CVS (Aetna) collectively enrolled 794,000 new members in 2024 out of 1.3 million total market growth more than 60% of all new enrollment. Looking at full-year 2024 data, Humana lost 259,000 members and Centene lost 87,000 members, while the top three national plans captured essentially all growth.
This concentration creates both opportunities and risks. For large national plans, scale enables investments in care management infrastructure, data analytics, provider contracting leverage, and Star rating improvement programs. For smaller regional plans, Blues plans, and provider-sponsored health plans, competing becomes increasingly difficult without comparable scale advantages.
Provider-sponsored health plans continue losing market share despite theoretical advantages in plan-provider integration. In 2024, PSHPs (predominantly nonprofit plans aligned with health systems) failed to capture meaningful growth. This suggests that distribution advantages—large broker networks, national brand recognition, and aggressive marketing budgets—matter more than care integration in driving enrollment.
The consolidation trend will likely continue absent significant regulatory intervention. MA plans benefit from network effects and scale economies that favor large, established players. This raises questions about long-term market structure: will MA evolve into an oligopoly dominated by three or four national plans, or will niche players find sustainable positions serving specific geographies or populations?
Practical Takeaways for U.S. Healthcare Leaders
For Health System Executives:
Develop MA-specific strategies – With MA exceeding 50% penetration in most markets, you cannot treat MA as an afterthought in strategic planning. Network contracting, care delivery models, and financial projections must explicitly account for MA’s distinct characteristics.
Invest in prior authorization management – The administrative burden of 50 million annual prior authorization requests is real and growing. Dedicated staff, workflow optimization, and potentially technology solutions are necessary to manage this efficiently.
Understand payment mechanics – Risk adjustment and coding matter enormously to MA plan financial performance. Health systems with value-based contracts or risk-sharing arrangements must understand HCC coding, documentation requirements, and risk score management.
Monitor post-acute care denials – If you operate skilled nursing facilities, inpatient rehab, or LTACHs, pay close attention to denial rates by plan. Denials that are three to sixteen times higher than overall rates create real financial and operational challenges.
For Payer Leaders:
Prepare for payment pressure – The $76 billion overpayment estimate and $1.2 trillion ten-year projection are not going away. Regulatory changes targeting overpayments are likely within the next 12-36 months. Bid strategies must account for potential benchmark reductions and tighter coding intensity adjustments.
Balance growth and margin – The era of unlimited benefit reinvestment to drive membership growth is ending. Financial sustainability requires more intentional ROI analysis on supplemental benefits and member retention strategies.
Navigate Star rating volatility – With ratings declining broadly and 5-star plans dropping from 74 in 2022 to 31 in 2024, maintaining high ratings will become harder and more expensive. Evaluate whether maximum Star pursuit remains cost-effective or whether a 4-star strategy provides better financial returns.
For Policy-Aware Operators:
Track regulatory developments – CMS rulemaking, MedPAC recommendations, and congressional investigations will drive significant changes. Prior authorization reforms, network adequacy standards, and payment methodology changes will all affect operations.
Document defensive positions – When prior authorization denials occur for services that meet Medicare coverage rules, maintain careful documentation. The 81.7% appeal overturn rate suggests opportunities to challenge inappropriate denials systematically.
Consider traditional Medicare’s advantage – Traditional Medicare’s administrative simplicity—no prior authorization, nationwide network, predictable payment—has value that isn’t fully reflected in enrollment trends. For some patient populations and provider types, traditional Medicare may offer better alignment despite MA’s financial generosity.
Medicare Advantage has become the dominant form of Medicare coverage, enrolling 54% of eligible beneficiaries and projected to reach 64% by 2034. This shift represents a fundamental restructuring of Medicare from a public fee-for-service program into a predominantly private managed care system.
However, this transformation comes with substantial costs and tradeoffs. Federal overpayments totaling $76 billion in 2026 projected to reach $1.2 trillion through 2035 raise serious questions about value and sustainability. Prior authorization burdens affecting 50 million requests annually, denial rates that disproportionately impact post-acute care, and coding practices that inflate risk scores without corresponding service delivery all warrant scrutiny.
For healthcare leaders, the strategic imperative is clear: you must understand Medicare Advantage deeply – its payment mechanics, operational requirements, regulatory trajectory, and market dynamics. This is no longer optional as MA transitions from an alternative program to the primary form of Medicare coverage. Success in this environment requires adapting care delivery, contracting strategies, and operational capabilities to MA’s fundamentally different structure while maintaining sustainable economics in an environment of increasing payment pressure and regulatory scrutiny.
The next 12-36 months will be defining. Payment reforms targeting over-payments, enhanced scrutiny of prior authorization practices, and continuing market consolidation will reshape the MA landscape. Organizations that anticipate these changes and position strategically will thrive; those that treat MA as simply “more Medicare” will face growing challenges.
Over the past few years, telehealth has evolved from a pandemic necessity into a pillar of modern care delivery. From virtual consultations and digital triage to chronic disease management and remote monitoring, telehealth has changed how patients and providers connect.
According to the American Hospital Association, 76% of U.S. hospitals now connect patients and clinicians using telehealth technology—a number that continues to grow as the healthcare ecosystem becomes more digital.
As we move into 2026, telehealth isn’t just about convenience; it’s about equity, access, and innovation. With new technologies, regulatory frameworks, and patient expectations shaping virtual care, understanding the latest trends and challenges is essential for every healthcare leader.
What is Telehealth and How It Works
Telehealth refers to the use of digital communication and information technologies such as video calls, mobile apps, and remote monitoring devices—to provide clinical services and healthcare support.
While telemedicine focuses primarily on clinical consultations, telehealth is broader, encompassing patient education, health administration, and remote diagnostics.
Today, most telehealth platforms integrate directly with Electronic Health Records (EHRs), allowing clinicians to access real-time patient data and streamline documentation. This interoperability is what makes telehealth sustainable and scalable for the future.
Key Trends Shaping Telehealth in 2026
1. Hybrid Care Models Becoming the New Normal
The future of telehealth lies in hybrid care a seamless blend of in-person and virtual visits. Patients prefer flexibility, and providers are adopting systems that allow patients to start their care journey online and continue it offline. Hospitals are investing in digital front doors, ensuring that patient access, scheduling, and follow-ups are fully integrated across channels.
2. AI and Predictive Analytics Enhancing Virtual Care
Artificial Intelligence (AI) is becoming a core driver of telehealth efficiency. From automated triage and symptom checking to predictive analytics for chronic disease management, AI helps clinicians make faster, more informed decisions. By 2026, expect to see AI-powered virtual assistants embedded in telehealth apps, guiding patients through appointments, medication adherence, and care reminders.
3. Expansion of Mental Health and Behavioral Telemedicine
Mental health continues to be one of the fastest-growing telehealth sectors. Platforms like BetterHelp and Talkspace have normalized therapy over video sessions, and health systems are extending behavioral care into rural areas through tele-psychiatry. The demand for accessible mental health services is expected to grow another 15–20% in 2026, driven by Gen Z and millennial populations prioritizing emotional well-being.
4. Wearables and Remote Patient Monitoring (RPM) Growth
Smartwatches and connected devices are enabling continuous, real-time health tracking. Remote Patient Monitoring (RPM) helps clinicians manage patients with conditions such as diabetes, hypertension, and heart disease without requiring frequent hospital visits. According to recent projections, the U.S. RPM market could surpass $4 billion by 2026, making it a central component of telehealth care plans.
5. Interoperability and Data Standardization Improvements
Data silos have long limited healthcare progress. However, initiatives like FHIR (Fast Healthcare Interoperability Resources) and HL7 standards are driving consistent data exchange between telehealth and EHR systems. This interoperability ensures providers have complete, accurate information at the point of care reducing redundancy and improving outcomes.
6. Value-Based Telehealth and Reimbursement Models
Telehealth is transitioning from a fee-for-service to a value-based care model. CMS and private payers are introducing flexible reimbursement pathways that reward outcomes instead of volume. By aligning telehealth with value-based metrics such as reduced hospital readmissions and improved chronic management providers can deliver more cost-effective care.
Major Benefits of Telehealth for Patients and Providers
1. Improved Access to Care
Telehealth removes geographical barriers. Patients in remote or underserved regions can now connect with top specialists without traveling long distances. This is especially critical for rural healthcare, where access to specialists is limited.
2. Cost Efficiency and Reduced Readmissions
Telehealth visits often cost 40–60% less than in-person appointments, making them more affordable for both patients and payers. Virtual follow-ups also reduce preventable readmissions saving hospitals millions in annual operational costs.
3. Convenience and Continuity of Care
From prescription refills to follow-up consultations, telehealth allows for consistent, on-demand care. Patients can schedule visits outside of traditional clinic hours, which significantly improves satisfaction and adherence.
4. Better Chronic Disease Management
For conditions like diabetes, COPD, or heart failure, remote monitoring combined with virtual coaching enables timely interventions. Clinicians can track metrics, identify red flags early, and adjust care plans proactively.
5. Enhanced Patient Engagement through Digital Tools
Interactive apps, automated reminders, and AI chatbots are encouraging patients to take charge of their health. This increased engagement leads to stronger patient-provider relationships and better long-term outcomes.
Key Challenges and Barriers to Telehealth Adoption
1. Data Security and Patient Privacy Concerns
With healthcare data breaches on the rise, security remains a top priority. Telehealth platforms must comply with HIPAA standards and ensure end-to-end encryption to maintain trust and regulatory compliance.
2. Reimbursement and Policy Inconsistencies
While many payers have expanded coverage for telehealth, reimbursement rates still vary across states and plans. Lack of clarity around billing codes and parity laws continues to slow adoption for smaller practices.
3. Technology Access and the Digital Divide
Not all patients have access to high-speed internet or smart devices. Bridging this digital divide especially for low-income or elderly populations—remains one of the biggest barriers to equitable virtual care.
4. Licensing and Cross-State Regulations
Clinicians practicing telehealth often face cross-state licensing challenges. The Interstate Medical Licensure Compact has simplified this for some, but national standardization is still evolving.
5. Clinical Limitations and Quality of Virtual Care
While telehealth works well for follow-ups and behavioral care, it’s not suitable for every clinical situation. Physical exams, imaging, and procedures still require in-person interactions. Balancing virtual and physical care remains a key challenge.
The Future of Telehealth Beyond 2026
The next generation of telehealth will focus on personalization, interoperability, and predictive care. Integration with AI, Internet of Things (IoT), and digital therapeutics will enable continuous health management that goes far beyond traditional visits.
Imagine a healthcare system where your smartwatch alerts your provider of early heart irregularities or an AI dashboard predicts a potential relapse before symptoms appear. That’s the direction telehealth is heading.
Final Thoughts – Building a Sustainable Telehealth Ecosystem
Telehealth has moved beyond being a temporary solution; it’s now a core pillar of healthcare transformation. To ensure sustainability, healthcare leaders must:
Strengthen data privacy and cybersecurity measures.
Push for unified reimbursement and regulatory frameworks.
Invest in training clinicians and expanding digital literacy among patients.
If stakeholders collaborate across technology, policy, and care delivery, telehealth will lead the next decade of accessible, connected, and patient-centered healthcare.
What are the key trends in telehealth for 2026?
Key telehealth trends for 2026 include hybrid care models, AI-driven diagnostics, expansion of mental health telemedicine, and improved interoperability.
What are the main benefits of telehealth?
Telehealth improves access to care, reduces costs, enhances chronic care management, and increases patient engagement through digital tools.
What challenges does telehealth face in 2026?
Major challenges include data security concerns, reimbursement issues, technology access gaps, and cross-state licensing barriers.
How will telehealth evolve beyond 2026?
Beyond 2026, telehealth will integrate more AI, IoT, and digital therapeutics to deliver personalized, data-driven care.
Healthcare providers know that not all patients are the same – some are generally healthy and need only routine check-ups, while others with complex conditions are one missed appointment away from a hospital visit. In fact, a small subset of high-risk patients can account for a disproportionate amount of healthcare utilization (for example, roughly 5% of patients drive 50% of healthcare costs). To effectively balance these extremes and improve outcomes, healthcare is embracing risk stratification. This approach involves proactively identifying which patients are at highest risk for poor outcomes or high costs, so care teams can prioritize interventions for those who need them most. In an era shifting toward value-based care – where quality and outcomes matter more than the volume of services – risk stratification has become essential for guiding precision care, reducing avoidable costs, and improving patient outcomes. Below, we delve into what risk stratification means, why it’s crucial for value-based care, various models in use, the benefits it delivers, challenges to be aware of, and what the future holds.
What is Risk Stratification?
Risk stratification in healthcare is the process of categorizing patients into risk groups based on their health status, predicted outcomes, and care needs. In practical terms, providers assess a variety of factors for each patient – from medical conditions and past utilization to social factors – and assign a risk level (for example, low, medium, or high risk). Patients in higher-risk tiers are those more likely to experience complications, hospitalization, or worsening health, and thus may require more proactive management. This systematic categorization allows clinicians and care managers to allocate resources and care intensity according to risk: high-risk patients get more attention and tailored interventions, while lower-risk patients can be managed with routine preventive care. The ultimate goal, as noted by the American Academy of Family Physicians (AAFP), is to “help patients achieve the best health and quality of life possible by preventing chronic disease, stabilizing current conditions, and preventing acceleration to higher-risk categories and higher associated costs.” In other words, effective risk stratification should lead to healthier patients who avoid complications, thereby also controlling costs.
How Risk Stratification Works:
In assessing risk, healthcare teams use both quantitative data and clinical judgment. Common inputs include a patient’s diagnoses and comorbidities, recent hospitalizations or ER visits, lab results and vital signs, medication adherence, and even psychosocial factors. Some risk stratification tools generate a composite risk score from these inputs. For example, the Johns Hopkins ACG® system groups patients into low, medium, or high-risk categories for healthcare utilization using multiple dimensions of data. Factors typically considered are:
Clinical factors: Diagnoses, chronic conditions, and overall health status.
Social determinants: Socioeconomic and environmental factors (income, housing stability, support network).
Behavioral factors: Health behaviors and adherence (e.g. medication compliance, lifestyle risks).
By applying such factors, a risk stratification algorithm (or a care team using a scoring rubric) can flag patients who are likely to need more intensive support. The practice then uses risk status as a guide to tailor care plans – for instance, enrolling a high-risk elderly patient with heart failure into a care management program, while ensuring a low-risk young patient continues with routine wellness checks. This targeted approach helps providers anticipate patient needs and intervene early, instead of reacting after a health crisis.
Importance in Value-Based Care
Risk stratification is especially important in the context of value-based care. Value-based care (VBC) programs reward healthcare organizations for improving patient health outcomes and controlling costs, rather than paying solely per service provided. In a value-driven model, providers are accountable for metrics like hospital readmissions, chronic disease control, patient satisfaction, and total cost of care. Identifying high-risk patients up front is central to succeeding under these incentives. Here’s why risk stratification is a linchpin of value-based strategies:
Preventive, Proactive Care: Instead of waiting for high-risk patients to land in the emergency room, care teams use risk stratification to spot them early and provide preventive interventions. This proactive approach reduces avoidable hospitalizations and adverse events, directly improving quality outcomes. As one article notes, “at the heart of value-based care lies risk stratification — classifying patients by risk and addressing potential health issues pre-emptively.”
Optimized Resource Allocation: Healthcare resources (care coordinators, specialists, remote monitoring devices, etc.) can be directed to the patients who need them most. In value-based care, this means costly interventions are focused on high-risk individuals where they can prevent larger expenses, rather than being spread thin or used reactively. By stratifying risk, organizations ensure that intensive services (like care management or home visits) are reserved for the top-risk tier, while lower-risk patients receive cost-effective routine care.
Improved Outcomes and Cost Control: Value-based contracts typically include financial rewards for better outcomes and penalties for poor outcomes or excess costs. Risk stratification helps improve metrics like readmission rates, chronic disease indicators, and overall population health. For example, predictive risk models embedded in VBC initiatives have enabled earlier interventions that reduced 30-day readmission rates by 12% in one study. Better outcomes naturally lead to cost savings – fewer ER visits and admissions mean lower expenditures, aligning with the value-based goal of reduced per capita cost.
Risk Adjustment for Fair Reimbursement: In many value-based payment models (like Medicare Advantage or ACOs), providers are compensated based on the risk profile of their patients. Accurate risk stratification (often using tools such as Hierarchical Condition Category (HCC) scores) ensures that organizations caring for sicker, high-risk populations receive appropriate resources and credit. This prevents a scenario where providers who take on more complex patients are financially penalized. In short, stratifying and adjusting for risk is essential to equitable, sustainable value-based reimbursement.
Overall, risk stratification provides the “compass” for value-based care. It guides care teams to deliver the right care at the right time to the right patients. By zeroing in on high-risk individuals for intensive management and keeping low-risk patients well through preventive services, healthcare organizations can achieve the triple aim of improved patient experience, better population health, and lower costs – which is exactly what value-based care strives for.
Risk Stratification Models
Risk stratification can be performed using different models and methodologies, ranging from simple clinical checklists to advanced AI algorithms. At its core, any risk stratification model aims to segment the patient population into tiers of risk and predict who is most likely to incur significant healthcare needs. Many organizations visualize this using a pyramid model of population risk, as shown below.
Risk stratification can be performed using different models and methodologies, ranging from simple clinical checklists to advanced AI algorithms. At its core, any risk stratification model aims to segment the patient population into tiers of risk and predict who is most likely to incur significant healthcare needs. Many organizations visualize this using a pyramid model of population risk.
Risk stratification is often illustrated as a pyramid. The broad base represents the majority of patients who are low risk and mainly need preventive care (wellness and primary prevention). The middle layers represent “rising risk” patients who have emerging health issues (needing secondary prevention to reduce complications) and “high risk” patients with chronic conditions requiring active management (tertiary prevention). The small apex represents the complex, highest-risk patients who need intensive, specialized care. This pyramid model helps healthcare teams prioritize: as risk level increases, care interventions become more intensive and resources are concentrated accordingly.
Risk stratification models can be broadly categorized into a few types. Below, we discuss three common model types and their characteristics:
1. Clinical Risk Models
Clinical risk models refer to traditional risk stratification approaches that rely on medical expertise, established clinical criteria, and often simple scoring systems. These models typically use clinical data (diagnoses, age, comorbidities, etc.) and past utilization to assign a risk level. Providers have long used various scoring tools and indices to gauge patient risk, such as:
Charlson Comorbidity Index – a score based on the number and seriousness of a patient’s chronic diseases, often used to predict mortality or complication risk.
LACE Index – a tool that predicts a patient’s 30-day readmission risk based on Length of stay, Acuity of admission, Comorbidities, and ED visits.
Hierarchical Condition Categories (HCC) – a risk adjustment model (used by CMS) that assigns a risk score to patients based on their diagnosed conditions and demographics, projecting future cost of care.
APACHE II/III (ICU scoring) – used in critical care to predict mortality risk for ICU patients based on acute physiology and chronic health evaluation.
Clinical models are often rule-based or regression-based, built on medical research that links certain factors to outcomes. For example, a simple clinical model might stratify diabetics as high-risk if they have complications like heart disease and frequent hospitalizations, versus low-risk if their disease is mild and controlled. These models can be deployed via EHR templates or provider workflows relatively easily, and many EHR systems come with a built-in risk stratification module using clinical rules.
However, traditional clinical risk models have some limitations. They are usually static, updating only when a provider periodically reviews data or when new data (like a diagnosis) is entered. They may not account for real-time changes in a patient’s condition or subtler risk contributors. For instance, a Charlson Comorbidity score might not change until a new diagnosis is added, even if the patient’s health is quietly deteriorating. Moreover, these models focus mostly on medical factors and often omit social or behavioral dimensions. Despite these drawbacks, clinical risk stratification provides a foundational starting point, and many healthcare practices successfully use these models to segment patients. For example, a primary care clinic might use a condition count (number of chronic illnesses) as a simple risk stratifier: patients with 0–1 chronic conditions = low risk, 2–3 = medium risk, 4+ or any hospitalization in past year = high risk. Such approaches are intuitive and easy to implement, though they can be refined further with technology.
It’s worth noting that advanced clinical models (often available as commercial products) combine multiple data sources. Tools like the Johns Hopkins ACG® System or the Elder Risk Assessment (ERA) score use diagnoses, pharmacy data, and sometimes basic demographic risk factors to produce a more nuanced risk score. These have been validated and can outperform very simplistic methods. Still, the general trend is that healthcare organizations are moving beyond purely clinical static models toward more dynamic, data-driven approaches.
2. Predictive Analytics Models
Predictive analytics models represent the next generation of risk stratification. These models leverage large datasets, machine learning (ML), and artificial intelligence (AI) algorithms to predict future health risks with greater accuracy and often in real-time. Instead of relying solely on predefined rules, predictive models learn patterns from historical data. They can incorporate a wide array of inputs—electronic health record data, claims data, lab results, medication fill data, socio-demographic data, and even patient-generated data from wearables. The goal is to identify subtle indicators that a patient may be heading towards a bad outcome (like an unplanned hospitalization) so that the care team can intervene early.
These models have shown impressive results in various studies. For example, research by Google AI scientists demonstrated that deep learning models using EHR data predicted hospital inpatient outcomes (mortality, readmission, length of stay) more accurately than traditional clinical risk scores. Similarly, machine learning algorithms have outperformed conventional tools in predicting which heart failure patients are at risk of readmission. The advantage of predictive models is their ability to handle complex, non-linear interactions among variables and to continuously improve as more data is fed into them.
Key features of predictive risk stratification models include:
Dynamic Updating: Unlike static scores, AI-driven risk scores can update in real time. If a patient’s blood pressure has been creeping up over months, or if they suddenly miss several medication refills, a predictive model can adjust that patient’s risk level immediately. This timeliness allows providers to catch issues before they escalate. In practice, hospitals using AI-powered risk dashboards have seen tangible benefits; one report noted that using predictive analytics to flag rising-risk patients helped reduce avoidable ER visits by up to 30%.
Multi-Modal Data Integration: Predictive models ingest a wide variety of data. They might analyze unstructured clinicians’ notes for signs of frailty, trends in vital signs, or patterns like frequent calls to an advice nurse. Importantly, many advanced models now include social and environmental data (more on that below). Incorporating diverse data types leads to enhanced accuracy. For instance, a model that knows a patient’s prescription fill gaps (medication non-adherence) and living situation (e.g. lives alone) can predict risk of complications better than a model that only sees diagnosis codes.
Early Warning and Precision: These analytics often power risk prediction tools that highlight patients at risk for specific outcomes (like “high risk of hospitalization in next 6 months” or “high risk of opioid overdose”). By predicting who is likely to suffer an adverse event and why, predictive models enable tailored, preventive action. For example, if a model predicts a patient has a high risk of hospitalization due to heart failure decompensation, the care team can arrange a home health visit or adjust medications now, potentially avoiding the hospitalization.
Implementing predictive risk stratification requires technology infrastructure and expertise. Healthcare organizations need data scientists or analytics vendors, robust IT systems, and quality data inputs. Despite these requirements, the trend is clear: AI-driven risk stratification is transforming care delivery. As one health IT expert put it, “traditional risk models are static and don’t account for real-time changes… AI-driven analytics can adjust risk scores dynamically as new patient data comes in.” Many health systems are now integrating such tools into their population health management platforms and care management workflows, closing care gaps more efficiently. In sum, predictive analytics models take risk stratification to a more granular and proactive level, enabling truly preventive healthcare.
3. Social Determinants of Health Models
One of the most important evolutions in risk stratification is the incorporation of social determinants of health (SDOH) into risk models. Social determinants are the non-medical factors that influence health outcomes – things like economic stability, education, neighborhood and environment, food security, social support, and access to healthcare. Research suggests that these social and environmental factors can account for a huge portion of health outcomes (by some estimates, upwards of 80% of health outcome variance). Therefore, ignoring SDOH can lead to an incomplete picture of patient risk.
SDOH-enhanced risk stratification models aim to identify patients whose social needs or barriers put them at higher risk of poor outcomes, even if their clinical profile alone might not seem high-risk. For example, consider two patients with diabetes and similar clinical metrics. Patient A has a stable job, family support, and good health insurance. Patient B struggles with housing insecurity and cannot afford healthy food or medications regularly. Traditional clinical risk models might rate them equally, but common sense (and outcomes data) tell us Patient B is more likely to have complications or hospitalizations. If we integrate social risk factors into the stratification, Patient B would justifiably be flagged as higher risk, prompting additional support (like a social worker referral or community resource assistance).
Some ways SDOH are incorporated into risk stratification include:
Adding a Social Risk Score: Tools like the PRAPARE (Protocol for Responding to and Assessing Patients’ Assets, Risks, and Experiences) model create a social risk score based on factors such as poverty, housing stability, and education level. This score can be used alongside clinical risk scores. For instance, a clinic might stratify patients by clinical risk and bump them up one risk level if they have high social risk (e.g., homelessness or no family support).
Integrated Predictive Models: Advanced AI models, such as those used by Medical Home Network (MHN) in Chicago, incorporate SDOH data directly into their algorithms. In a recent study, MHN’s AI-driven model combined claims data, demographics, and real-time inputs like social needs assessments and hospital admissions data to predict future high-cost patients. It identified more high-risk and rising-risk patients than traditional models that rely only on medical claims. The key insight was that past healthcare spending alone isn’t a complete predictor of future needs, especially in underserved populations. By including real-time social data and events (like a new housing instability or a job loss), the model provided a more actionable and equitable risk stratification, allowing care teams to devote resources to patients with the most pressing needs.
Community-Level Risk Mapping: Some population health programs stratify by geography or community, recognizing that a patient’s ZIP code can be as predictive of health risk as their genetic code. For example, public health departments might layer maps of emergency visit hotspots with socioeconomic data to find high-risk neighborhoods. Patients in those areas could be considered higher risk due to environmental factors (lack of transportation, food deserts, pollution, etc.) and prioritized for certain interventions.
In practice, incorporating SDOH into risk stratification has demonstrated benefits. It can uncover hidden risk – patients who might look “low-risk” clinically but are actually at high risk of deteriorating due to social factors. It also aligns with broader health equity goals: by identifying social drivers of health outcomes, healthcare organizations can tailor interventions to reduce disparities. For instance, an SDOH-informed model might flag that a certain group of patients with asthma from a particular area is high-risk due to air quality issues and poor housing conditions; the intervention could then include environmental health referrals or housing assistance in addition to medical treatment.
Challenges with SDOH models: Getting accurate social data is not always easy. It often requires screening patients (e.g., questionnaires about housing, finances, etc.) or using proxy data (like area-level census information). Data privacy and patient consent are considerations, too, when using personal social information. Moreover, even once high social risk patients are identified, addressing those needs may involve resources outside the traditional healthcare system (community organizations, social services). Despite these challenges, the trend is unmistakable: social determinants are now recognized as integral to risk stratification, and healthcare providers, payers, and policymakers are increasingly investing in tools to integrate these factors. By doing so, they aim to provide more holistic, whole-person care and improve outcomes in vulnerable populations.
Benefits of Risk Stratification
Risk stratification offers a range of benefits that enhance patient care and health system performance. At its core, stratifying risk helps ensure the right patients get the right care at the right time, which leads to better outcomes and more efficient use of resources. Let’s break down the key benefits:
Targeted Intervention: By pinpointing which patients are at highest risk (for hospitalization, complications, etc.), providers can deliver personalized interventions to those individuals. High-risk patients receive timely, intensive support (e.g. frequent follow-ups, care management programs), while lower-risk patients can be managed with routine care. This targeting means patients who need immediate attention get it promptly, preventing many health issues from escalating.
Streamlining Resource Allocation: Risk stratification helps healthcare organizations prioritize and allocate resources optimally. For example, care coordinators and specialists can focus their efforts on a defined high-risk cohort, nurses can schedule longer appointments for complex patients, and programs like home visits or telehealth monitoring can be reserved for those likely to benefit most. This ensures finite resources (staff time, hospital beds, budget) are used where they have the greatest impact, avoiding waste and improving overall system efficiency.
Improved Cost-Efficiency: A major benefit of focusing on high-risk patients is cost reduction. By intervening early and preventing avoidable events like emergency visits or readmissions, risk stratification helps bend the cost curve. High-risk, chronically ill patients account for a large share of healthcare spending, so preventing one hospitalization or ER visit in this group yields far larger savings than the same prevention in a low-risk group. Studies show that proactive risk management (e.g. using predictive analytics to reduce acute events) can significantly cut costs – for instance, hospitals employing risk stratified care management have seen hospitalization rates drop and total costs decrease by double-digit percentages. In practice, clinics using risk stratification report lower overall spending and improved financial performance in value-based contracts, since they avoid penalties (like readmission fines) and earn savings bonuses by managing risks.
Enhanced Patient Engagement: When care is tailored to a patient’s risk and needs, patients often feel more seen and supported. High-risk patients might get a dedicated care manager who checks in on them, while rising-risk patients might receive education and coaching. This personalized attention can increase patient engagement in their own care – for example, a patient with uncontrolled diabetes who is identified as high-risk might receive nutrition counseling, medication reminders, and remote glucose monitoring, which motivate them to stay on track. Engaged patients are more likely to adhere to treatment plans, leading to better health outcomes. Additionally, knowing their provider is proactively monitoring their well-being (sometimes even reaching out before they themselves sense a problem) builds trust and satisfaction.
Care Coordination and Collaboration: Risk stratification naturally leads to better care coordination. Once high-risk patients are identified, providers can assemble multidisciplinary care teams (primary care, specialists, pharmacists, social workers, etc.) and develop coordinated care plans. For example, a high-risk senior with COPD and heart failure might have her pulmonologist and cardiologist coordinating with her primary care physician and a case manager to ensure all aspects of her health are addressed. This team-based approach, guided by risk stratification, reduces duplication of services and prevents patients from “falling through the cracks.” It’s been shown that identifying patients for coordinated care programs via risk stratification improves outcomes – those patients get more consistent follow-up and support, resulting in fewer crises.
Reducing Health Disparities: As mentioned, incorporating social determinants into risk stratification can highlight at-risk subpopulations that might otherwise be overlooked. By doing so, healthcare systems can deploy targeted programs to reduce disparities. For instance, if risk stratification reveals that patients in a certain low-income neighborhood have high risk due to poor access to transportation (leading to missed appointments and deteriorating health), a provider might introduce mobile clinics or transportation vouchers for that community. In this way, risk stratification supports health equity by ensuring high-need groups get appropriate resources. Over time, this can narrow gaps in outcomes between different socioeconomic or racial groups.
Supports Value-Based Care Goals: All the above benefits feed into success in value-based care. Targeted interventions mean better clinical outcomes; efficient resource use means lower costs; improved engagement and coordination mean higher patient satisfaction and quality scores. Risk stratification, therefore, is a foundational capability for any organization looking to excel under value-based payment models. It provides the data-driven framework to achieve the core aims of VBC: better care, smarter spending, and healthier populations.
In summary, when done well, risk stratification creates a win-win: patients receive more appropriate, proactive care, and the healthcare system operates more effectively and cost-efficiently. To illustrate these benefits further, let’s examine a few specific areas improved by risk stratification: patient outcomes, cost reduction, and care coordination.
Patient Outcomes
Effective risk stratification has a direct, positive impact on patient health outcomes. By identifying high-risk patients and intervening early, providers can prevent complications or worsening of diseases, leading to healthier, more stable patients. A classic example is in chronic disease management: if a clinic knows which patients with hypertension or diabetes are at highest risk for, say, a stroke or hospitalization, they can intensify management for those patients (more frequent monitoring, medication adjustments, education on warning signs) and thereby prevent many adverse outcomes.
Studies and reports back this up. In primary care, timely interventions for high-risk individuals lead to better health outcomes and fewer serious events. For instance, one program that stratified and closely managed high-risk heart failure patients saw improvements in functional status and a reduction in acute exacerbations. Another example: risk stratification tools have been used to flag patients likely to skip medications or follow-ups, allowing care teams to reach out and re-engage them – this improves disease control and reduces the chance of a health crisis.
Preventive care is another domain where outcomes improve. Risk stratification can highlight “rising-risk” patients (those not very sick now but with many risk factors) who might benefit from prevention programs. By enrolling these patients in lifestyle modification classes or early specialty referrals, providers can stop the progression of disease. The AAFP notes that a key aim of risk stratification is preventing patients from accelerating to higher-risk, higher-acuity categories. Achieving this means those patients avoid things like uncontrolled diabetes leading to neuropathy or kidney failure, or mild COPD not becoming severe COPD – clearly better health outcomes for the individuals.
One concrete outcome measure often cited is hospital readmissions. Patients who are identified as high-risk for readmission can be given enhanced discharge planning and post-discharge support (like follow-up calls, home visits). As a result, readmission rates drop, which is a significant quality win. In a value-based care setting, a reduction in 30-day readmissions not only reflects better patient recovery but also avoids penalties (for Medicare patients). Similarly, mortality outcomes can improve when high-risk patients are managed proactively – e.g., sepsis early warning systems (a form of risk stratification in the hospital) have reduced in-hospital mortality by triggering rapid responses.
In short, risk stratification saves lives and improves quality of life. Patients achieve more stable control of chronic conditions, suffer fewer acute episodes, and maintain better overall health. They receive “the right care at the right time,” which is exactly what outcome-oriented healthcare strives for.
Cost Reduction
The financial benefits of risk stratification are significant. By reducing preventable healthcare utilization and focusing resources efficiently, risk stratification helps curb unnecessary spending. Consider this: High-risk patients with multiple chronic conditions drive the bulk of healthcare costs (as noted, 5% of patients can account for ~50% of costs). If we can even moderately improve care for that 5%, the cost savings are substantial. Risk stratification is the mechanism to do exactly that – identify those high-cost patients and manage them to avoid the most expensive outcomes.
One way costs are reduced is through fewer hospitalizations and emergency visits, which are among the costliest services. When a predictive model flags a patient who is headed toward an ER visit (say, due to worsening heart failure), and the care team intervenes with a medication tweak or a same-day clinic visit, a potential $5,000 ER trip and $15,000 hospital admission might be averted. Multiply such interventions across a population, and the savings add up. In fact, healthcare organizations that have systematically applied risk stratified care management have reported 15-30% reductions in hospitalization or ER utilization rates for targeted groups, translating to millions in savings.
Another aspect is preventing chronic disease complications, which are expensive to treat. For example, tight control of blood sugar in high-risk diabetics (achieved by identifying them and ensuring they get extra support) can prevent complications like amputations or dialysis down the road. Those complications are extremely costly, so prevention saves money long-term. While it’s hard to “see” the cost of an event that didn’t happen, population-level studies confirm that areas or systems with robust preventive care have lower per-capita healthcare costs over time.
Risk stratification also contributes to cost efficiency by ensuring each level of care is used appropriately. Low-risk patients, for instance, might not need specialist referrals or advanced imaging; keeping their care streamlined avoids overtreatment costs. High-risk patients, on the other hand, get intensive care which prevents even costlier outcomes. In effect, stratification prevents both overuse and underuse of healthcare resources, both of which have cost implications.
For providers in value-based contracts (ACO shared savings, capitated arrangements, etc.), these cost reductions directly improve the bottom line. If you can lower the total cost of care for your population while maintaining quality, you retain more of the capitated payments or earn shared savings bonuses. Risk stratification is a critical tool for meeting these financial targets, as it allows focusing interventions where they will yield the greatest cost avoidance.
Finally, consider operational costs: risk stratification can help practices use staff more effectively (for example, dedicating nurses to care management for the top 10% high-risk patients yields more ROI than spreading their time thin across all patients). By stratifying, a practice might decide to invest in a diabetes educator only for those at highest risk, rather than paying for everyone to have that resource. This kind of targeted allocation improves the cost-effectiveness of every dollar spent on personnel or programs.
In summary, by preventing expensive health crises and ensuring efficient care delivery, risk stratification cuts wasteful spending. It is a cornerstone of cost containment in modern healthcare. Patients benefit from fewer bills and payers/providers benefit from lower expenditures – a true win-win.
Care Coordination
Improved care coordination is another major benefit of risk stratification, closely tied to better outcomes and patient satisfaction. When high-risk patients are identified, it becomes clear that these patients often have complex needs that span multiple providers and settings. Risk stratification gives healthcare teams a clear signal on who requires active coordination and follow-up, essentially creating a priority list for care management efforts.
For high-risk patients, simply having a primary care visit now and then isn’t enough; they might see specialists, have home care needs, require social services, etc. Risk stratification programs typically assign such patients to care coordinators or case managers who act as quarterbacks for their care. This leads to more synchronized care: the primary doctor knows what the cardiologist did, the nurse care manager ensures the patient understands their medications and follows up on referrals, and so on. The result is that the patient’s care is delivered in a more organized, continuous fashion rather than a fragmented, episodic way.
Take for example a patient with COPD, diabetes, and depression – a classic high-risk profile. Through risk stratification, the care team flags this patient and creates a coordinated care plan. A case manager might arrange regular phone check-ins to monitor COPD symptoms, a pharmacist might review their medications for any conflicts, a mental health counselor might be looped in to address depression (which if unmanaged could worsen their ability to manage other conditions). All these professionals communicate and share information. This level of coordination helps avoid pitfalls like medication errors, conflicting advice, or the patient falling off the radar. It also improves the patient’s experience because they feel supported by a team that’s on the same page.
Even for moderate or rising-risk patients, coordination is beneficial. For instance, a patient at rising risk could be referred to a nutritionist and a diabetes education class—risk stratification ensures those coordination efforts happen before the patient becomes high-risk.
Risk stratification can also inform specialist referrals and transitions of care. It can highlight patients who would benefit from seeing, say, a nephrologist early because their kidney function is trending downwards, or those who need palliative care involvement. Ensuring timely referrals means the patient gets comprehensive care. It’s been noted that risk stratification is used to select patients who would benefit from working with a specialist or from coordinated care solutions. This ensures no one who truly needs advanced care is overlooked.
Additionally, when patients are stratified, healthcare teams often implement structured communication routines like daily huddles or weekly meetings focusing on high-risk patients. In these, they discuss care plans, recent hospital visits, and any barriers. This kind of team communication is a hallmark of good care coordination and arises naturally from a risk-focused approach.
From a systems perspective, improved coordination reduces redundant tests and procedures (saving cost) and prevents miscommunications that could lead to errors. For the patient, it means smoother transitions (such as from hospital to home – where a coordinator calls them within 48 hours to follow up), and overall a more seamless journey through the healthcare system.
In short, risk stratification activates a higher level of care coordination for those who need it most. It aligns multiple providers and services around the patient, which improves continuity of care and ultimately health outcomes. Patients with complex conditions especially benefit from this “air traffic control” approach that risk stratification makes possible, ensuring they don’t navigate their health challenges alone or unassisted.
Risk Stratification Challenges:
While risk stratification is powerful, implementing it is not without challenges. Healthcare organizations often encounter obstacles in data, technology, and ethics when developing and using risk models. Recognizing these challenges is important to address them effectively:
1. Data Quality and Integration
Data is the lifeblood of risk stratification, and data-related issues are perhaps the biggest challenge. To stratify patients accurately, you need comprehensive, high-quality data on each patient. This includes their medical history, current clinical measurements, utilization history, and ideally social factors. In reality, patient data is often scattered across different systems and may be incomplete or inaccurate. Many providers struggle with data integration – combining data from electronic health records (EHRs), pharmacy systems, hospital databases, and external sources into one unified view. If your risk model only sees part of the picture, it might misclassify patients. For example, if a patient was hospitalized at an outside facility that isn’t captured in your EHR, a risk algorithm might mistakenly label them low risk because it’s unaware of that hospitalization.
Data quality is another facet: EHR data can have errors (diagnosis codes not updated, missing lab results if done outside network, etc.). Social determinants data can be hard to quantify and keep current (a patient’s financial or housing situation can change quickly). Moreover, claims data used in many traditional models is lagged by several months, so it might not reflect a patient’s current status.
Interoperability standards like HL7 FHIR are helping by making it easier to pull data from multiple sources, but many organizations still face siloed systems. Smaller clinics might not have IT systems that talk to one another (e.g., mental health records separate from medical records), leading to fragmented data. Overcoming these silos often requires investment in health information exchange platforms or data warehouses – which can be costly and technically complex.
Another data challenge is ensuring real-time or up-to-date information. Risk is dynamic; a model should ideally know if a patient showed up at the ER yesterday or if their latest lab showed kidney function decline. Setting up feeds for real-time data (e.g., ADT feeds for admissions/discharges, or integrations with lab systems) is not trivial for many practices.
In summary, poor data quality or integration can lead to gaps in patient insights. A risk stratification is only as good as the data feeding it. If not addressed, this challenge can result in missed high-risk patients or misidentifying someone as high-risk when they’re not (false alarms). Health IT teams and population health managers must work continuously to improve data completeness – whether by manual data reconciliation, patient surveys (to get missing info), or technical interfaces between systems. Data governance policies also need to be in place to standardize how data is entered (so that, for example, diagnoses and social needs are coded consistently across the organization). Until data flows seamlessly and accurately, risk stratification will always have an uphill battle.
2. Technology and Implementation Limits
Even with good data, the technology and expertise required to implement advanced risk stratification can be a barrier. Not all healthcare organizations have a team of data scientists or can afford sophisticated analytics software. Smaller or resource-limited practices might rely on rudimentary methods (like manual spreadsheets or basic EHR reports) for risk stratification, which can limit the effectiveness of the process.
Adopting a commercial risk stratification tool or predictive analytics platform often involves significant cost and training. Organizations must consider factors like: Can our current IT infrastructure support this tool? Do we need to hire new analysts or consultants to use it? How will it integrate into clinical workflow? These considerations can be daunting. In fact, key factors a practice should evaluate before choosing a risk stratification model include the cost of the tool, the accessibility of required data, ease of implementation with their IT, and the relevance to their patient population. If any of these factors don’t align, the implementation may struggle or fail.
There’s also the challenge of workflow integration. Introducing a new risk score or stratification process means clinicians and staff need to change how they do things – maybe a new dashboard to check every morning, or new care management protocols for those flagged high-risk. Busy clinics might resist these changes, especially if they perceive it as extra work without immediate benefit. It takes strong change management and leadership support to embed risk stratification into routine care (for example, ensuring every morning huddle starts with reviewing high-risk patient lists, or empowering nurses to act on risk alerts).
Additionally, advanced models (like AI) can sometimes be a “black box,” and clinicians may be skeptical about trusting an algorithm’s output. Without clear understanding or explainability, providers might ignore the risk strat flags, which negates the whole point. Therefore, implementation often requires educating the care team on how the model works (at least at a high level) and why it’s useful.
Technical limitations can also crop up: a model might work well for a general adult population but not be calibrated for pediatric patients or OB/GYN patients, etc. If a practice serves a unique demographic, off-the-shelf models may need customization – which again demands tech expertise.
Computing infrastructure is another piece: real-time predictive analytics might require robust servers or cloud computing resources. Not every clinic has that readily available, though cloud-based solutions are making it easier for even smaller entities to use heavy analytics (at a price, of course).
Lastly, maintaining and updating models is a challenge. A risk model is not a “set and forget” tool; it needs periodic recalibration, especially if population characteristics change or if new data sources are added. Keeping the model up-to-date (or upgrading to newer, better models) requires ongoing work. If an organization lacks a champion or team dedicated to this, the model can quickly become stale or less accurate over time.
In summary, implementing risk stratification – especially the high-tech, AI-driven kind – requires substantial resources, planning, and change management. Organizations must navigate cost, data requirements, integration with existing systems, and user adoption. Those that can overcome these challenges reap the rewards; those that can’t may end up using only basic stratification approaches and not capturing the full value. As one healthcare executive advised, do a careful assessment of needs and capabilities, pilot test a model, and ensure leadership buy-in before rolling out a risk stratification program broadly.
3. Ethical and Privacy Concerns
Risk stratification, particularly when powered by AI and big data, raises several ethical concerns that healthcare providers and developers must be mindful of:
Bias and Fairness: Perhaps the most prominent concern is the potential for algorithms to perpetuate or even exacerbate biases. If the data used to train a predictive model contains biases (reflecting historical inequities in healthcare access or treatment), the model may produce biased risk predictions. A notable example is a widely used commercial risk score algorithm that was found to have. This algorithm, which helped determine who gets extra care management, was using healthcare cost as a proxy for need. Because historically less money was spent on Black patients (due to unequal access, etc.), the algorithm mistakenly scored Black patients as generally “lower risk” than equally sick White patients. In practice, this meant healthier White patients were getting into care management programs ahead of Black patients who actually had more severe health issues. Such biases in risk stratification can worsen disparities if not addressed. Ensuring algorithmic fairness is a major challenge – models should be tested for bias across race, gender, socioeconomic status, and adjusted if needed so that risk scores truly reflect need, not historical utilization patterns.
Transparency: Related to bias is the issue of transparency. Clinicians and patients may ask, “Why am I (or is this patient) rated high risk?” If the model is a complex machine learning algorithm, it might be hard to explain in simple terms. A lack of transparency can undermine trust in the system. Ethically, there’s a push for more “explainable AI” in healthcare so that the rationale behind a risk score can be communicated. For instance, instead of just labeling a patient high risk, an algorithm might highlight that the patient’s risk is driven by factors like “uncontrolled diabetes + recent hospital visit + living alone with limited support.” That kind of explanation helps providers validate and act on the risk information. When models are black boxes, providers might be hesitant to follow their guidance, or patients might be confused or fearful about being labeled without understanding why.
Patient Autonomy and Labeling: Labeling patients as “high risk” could potentially have unintended consequences. Patients might internalize the label negatively or face discrimination. For example, could a “high risk” label influence an insurer’s decisions or a provider’s attitude in a way that isn’t beneficial? It’s an ethical concern to ensure that labels are used to help patients, not to limit their care. Also, patients should ideally be informed and involved in their care plans – if a patient is identified as high risk for non-adherence, how do we involve them in addressing that without casting blame? Respecting patient autonomy means perhaps getting consent for certain uses of their data or at least being transparent that these risk stratification processes are happening.
Privacy and Data Security: To stratify risk, especially using SDOH and other extensive data, healthcare systems are aggregating a lot of personal information. This raises privacy concerns. Patients might be okay sharing medical info but less comfortable with healthcare systems using data about their income, neighborhood, or buying habits (some third-party data vendors provide such info). There’s an ethical obligation to protect patient data and use it responsibly. Data breaches are a risk whenever big data is collected. Moreover, some patients might not want to disclose social information out of fear of stigma. Ensuring robust privacy safeguards and being transparent about data use is crucial to maintain trust.
Intervention Ethics: Another angle is, once you’ve identified someone as high risk, what you do with that information has ethical implications. For example, if an algorithm flags someone as high suicide risk, the care team has a responsibility to act (which is good, but also must be done sensitively to respect patient rights). Or if someone is high risk for costing a lot, a financial-minded entity might be tempted to “manage them out” (for instance, an insurer might drop a high-cost patient – which is unethical in healthcare and illegal in many cases, but one must be cautious that risk stratification isn’t misused in such a way). The focus should always remain on using risk info to provide better care, not deny it.
Dependency and Automation Bias: Ethically, we also worry that clinicians might over-rely on algorithms (automation bias) and possibly ignore their own judgment or patient preferences. If a risk tool isn’t perfectly accurate (none are), a slavish adherence to it could be harmful. For example, if a model somehow fails to flag a patient who is actually in trouble (false negative), clinicians still need to use their eyes and ears and not become complacent. Balancing algorithm guidance with human judgment is important for ethical patient care.
Addressing these ethical concerns involves several strategies: using diverse and representative data to train models, performing bias audits on algorithms regularly, incorporating fairness adjustments (there is growing research on algorithmic fairness in healthcare), ensuring privacy by following HIPAA and perhaps de-identifying data when possible, and being transparent with both clinicians and patients about how risk scores are generated and used. Some health systems have even formed ethics boards to review AI use in patient care.
In the end, risk stratification should be a tool for good – to enhance care and equity – and not inadvertently worsen inequalities or erode trust. It’s an ongoing effort to ensure that as we adopt more advanced analytics, we also bolster our ethical guardrails.
Future Outlook
The future of risk stratification in healthcare is dynamic and highly promising, fueled by advances in technology, data science, and an increasing emphasis on holistic patient care. We can expect risk stratification to become even more precise, proactive, and seamlessly integrated into healthcare delivery in the coming years. Here are some key trends and developments shaping the future outlook:
Advanced AI and Real-Time Risk Prediction: Artificial intelligence will continue to revolutionize risk stratification. We’re moving toward a reality where AI can forecast a person’s risk for multiple conditions with remarkable accuracy, even decades into the future. For example, emerging AI models can analyze genetic information alongside clinical data to predict the likelihood of developing certain diseases 5, 10, or 20 years down the line. This will enable truly preventive interventions. By 2025 and beyond, expect wider adoption of predictive AI tools that continuously learn from new data and update patient risk scores in real time. This means if a patient’s wearable device detects an arrhythmia tonight, tomorrow the risk platform flags them for a check-in – risk stratification will be an always-on, live process rather than a periodic review.
Precision Medicine and Genomic Data Integration: The future will likely see risk stratification incorporating genomic and biomarker data to a greater extent. Polygenic risk scores (which aggregate the effects of many genetic variants) are already showing promise in identifying individuals at high inherited risk for conditions like heart disease or breast cancer. Integrating these into risk models could lead to a more personalized stratification – not just who is high risk today, but who is predisposed to become high risk in the future, so that early preventive steps can be taken. As genomic testing becomes more common, a patient’s genetic risk profile might be part of their health record that feeds into risk algorithms.
IoT and Remote Monitoring: The Internet of Things (IoT) in healthcare – including smart wearables and home monitoring devices – will significantly enrich risk stratification models. Constant streams of real-time patient data (heart rate, blood glucose, oxygen levels, medication adherence via smart pill bottles, etc.) mean that risk assessment can adjust day by day. If a normally stable patient’s remote blood pressure readings start trending upward, the system will catch it and adjust their risk level accordingly, prompting earlier intervention. Remote monitoring has already been shown to reduce hospital readmissions by about 25% through early detection of issues, and those benefits will grow as more patients use these devices. Essentially, the home will become an extension of healthcare, and risk stratification will draw from both in-clinic and at-home data to create a continuous health surveillance (in a positive sense) that keeps patients safer.
Integration of SDOH and Community Data at Scale: In the future, we will likely have much better data on social determinants – possibly through regional or national data exchanges. We might see standardized SDOH data elements (there are initiatives already to standardize how SDOH information is collected and shared). This will allow risk stratification models to use community-level data (like neighborhood air quality, local crime rates, or community health resources available) to refine individual risk scores. There is also a push toward “whole-person” care, meaning risk stratification will not just trigger medical interventions but also social interventions. For example, a high social-risk patient might be auto-referred to a community health worker program alongside medical follow-up. The lines between healthcare and social care will blur in risk management, because the industry recognizes that’s how we truly improve outcomes.
Better User Interface and Workflow Integration: We’ll likely see risk stratification tools become more user-friendly for clinicians. Instead of separate dashboards that busy providers have to remember to check, risk insights will be embedded directly into the EHR interface and clinical workflow (e.g., an alert pops up in the chart that “this patient is high risk for hospitalization within 3 months; consider scheduling a follow-up in 2 weeks”). Natural language processing might summarize risk factors from doctor’s notes to contribute to the risk score behind the scenes. The goal will be making the technology invisible and the insights actionable – clinicians shouldn’t have to be data analysts to benefit from these tools.
Continuous Learning Health Systems: As more healthcare systems implement these advanced stratification models, a feedback loop will emerge. Outcomes data (did the predicted event happen or not? did the intervention work?) will flow back to refine the models. We’ll have learning systems where each care interaction makes the model smarter. Also, collaboration between organizations (sharing de-identified data) could lead to more powerful, generalized models that everyone can use. It’s conceivable that national networks of data may produce risk stratification benchmarks or even AI that can predict public health trends (like identifying risk of an infectious disease outbreak in a region by aggregating data).
Ethical AI and Fairness Controls: Given the concerns we discussed, future risk stratification will also come with built-in fairness and bias monitoring. Regulators and industry groups might establish standards for validating that risk models don’t discriminate. We may see required periodic audits or certification processes for algorithms, especially as they become more central to care decisions. This is a positive development – ensuring that as tech advances, it does so equitably.
Greater Patient Engagement through Transparency: The future might also involve sharing risk information more openly with patients. Right now, risk stratification is mostly a “back-end” process clinicians use. But imagine if patients had access to a personalized risk dashboard through patient portals: it could increase their engagement (for example, “Your risk for heart complications is high; here are 3 things you can do and programs available to help reduce it”). As digital health literacy improves, patients might take a more active role in modifying their risk factors if they’re made aware of them in a clear way.
Looking ahead, risk stratification will be a cornerstone of preventive, personalized healthcare. It aligns perfectly with the shift from volume to value, and from reactive care to proactive care. We foresee a healthcare system where every patient’s risk profile is continuously updated and managed as part of routine care – much like vital signs are monitored today. High-risk patients will receive swift, tailored interventions; moderate-risk patients will get support to prevent escalation; low-risk individuals will be kept well with minimal intervention but never falling off the radar. This vision leads to healthier populations, less strain on hospitals, and more efficient use of resources.
In conclusion, the evolution of risk stratification signals a future where healthcare is data-driven, predictive, and patient-centric like never before. Providers, policymakers, and health tech innovators should invest in and embrace these tools now, as they will form the backbone of tomorrow’s healthcare delivery. The time to act is now: healthcare organizations that leverage modern risk stratification and care management strategies will be poised to lead in delivering high-value care, improving patient lives while wisely managing resources. By harnessing the power of data and technology ethically and effectively, we can ensure that every patient gets the care they need before a crisis happens – truly fulfilling the promise of a smarter, healthier future for all.
FAQ
Q: What is risk stratification in healthcare? A: Risk stratification in healthcare is a systematic method of categorizing patients by their health risk levels. Providers evaluate factors like medical conditions, past hospital use, and social needs to assign each patient a risk status (for example, low, medium, or high risk). This helps identify which patients are most likely to experience serious health issues or hospitalizations in the near future.
Q: How is risk stratification used in value-based care? A: In value-based care models, providers are rewarded for keeping patients healthy and reducing unnecessary costs. Risk stratification is a critical tool in this approach. By stratifying patients, healthcare organizations can focus their resources on high-risk individuals who are likely to drive up costs with complications or hospital visits.
Q: What are some examples of risk stratification models? A: Examples of risk stratification models range from simple to complex. On the simpler side, many primary care practices use a condition count or tiering system – e.g., 0-1 chronic conditions = low risk, 2-3 = medium, 4+ or recent hospitalization = high risk. More formal tools include the Charlson Comorbidity Index, which assigns points for different illnesses to predict risk of death or hospitalization, and the LACE Index for readmission risk which uses Length of stay, Acuity, Comorbidities, and ER visits. Health plans and Medicare use the Hierarchical Condition Category (HCC) model, which calculates a risk score based on diagnoses and demographics (useful for predicting costs).
Q: Why is risk stratification important for patient care? A: Risk stratification is important because it makes patient care more proactive, personalized, and effective. Instead of a one-size-fits-all approach, providers use stratification to determine who needs what kind of care intensity. High-risk patients (for example, someone with multiple chronic illnesses and recent hospitalizations) can be flagged to receive interventions like frequent follow-ups, home care visits, or specialist consultations before they suffer a serious complication. This can prevent health crises and stabilize the patient’s condition. Medium-risk patients might get moderate interventions like chronic disease coaching to keep them from becoming high-risk.
Q: Can risk stratification help reduce healthcare costs? A: Yes, risk stratification is a proven strategy for reducing healthcare costs. The principle is that a small percentage of patients (often those with complex, uncontrolled conditions) account for the majority of healthcare spending. By identifying these high-cost, high-need patients through stratification, healthcare systems can target them with intensive care management that prevents expensive events like emergency visits, hospitalizations, or complications.
Imagine a busy clinic employee accidentally emailing a patient’s record to the wrong person, or a stolen laptop exposing thousands of medical files. Such scenarios highlight why HIPAA compliance is mission-critical for healthcare organizations. The Health Insurance Portability and Accountability Act (HIPAA) of 1996 set strict privacy and security standards to protect sensitive patient data. Non-compliance can lead to hefty fines and damage to trust – in 2023 alone, 553 healthcare data breaches were reported, impacting over 109 million patients. This guide breaks down what HIPAA is, the key Privacy and Security Rule requirements, common pitfalls that lead to violations, and best practices to keep your organization compliant. Whether you’re a healthcare provider, IT professional, or compliance officer, read on to ensure you’re meeting HIPAA’s standards and safeguarding patient information.
What is HIPAA?
HIPAA (Health Insurance Portability and Accountability Act) is a U.S. law enacted in 1996 to modernize the flow of healthcare information and protect patient privacy. Over time, HHS implemented regulations under HIPAA – notably the Privacy Rule and Security Rule – that establish national standards for how healthcare data must be protected. HIPAA applies to “covered entities” (health plans, healthcare providers, and clearinghouses) as well as their “business associates” (vendors handling health data). The law defines protected health information (PHI) as individually identifiable health data (e.g. medical records, billing info) and mandates strict controls over its use and disclosure.
In essence, HIPAA compliance means implementing processes and safeguards to ensure patient health information stays private, secure, and accessible only to authorized parties. It’s not a one-time task but an ongoing culture of privacy and security that organizations must embed in daily operations. Below, we explain the two core HIPAA rules – the Privacy Rule and Security Rule – and what they require.
The HIPAA Privacy Rule
The HIPAA Privacy Rule establishes a federal floor of privacy protections for health information. It limits how covered entities and business associates may use or disclose patients’ PHI without authorization, and it grants patients important rights over their own health data. Put simply, the Privacy Rule is about “who, when, and why” patient information can be shared.
Patient Rights under the Privacy Rule
Under HIPAA’s Privacy Rule, patients enjoy strong rights regarding their health information. Covered entities must provide patients with a Notice of Privacy Practices informing them of these rights. Key patient rights include:
Access to Records: Patients have the right to view and obtain copies of their medical records and other PHI within 30 days of request (with limited exceptions). This empowers individuals to stay informed about their care.
Request Corrections: If a patient finds errors or omissions in their health records, they can request a correction or amendment. The provider must respond and, if they deny the request, explain why.
Disclosure Accounting: Patients can request an accounting of disclosures, which is a report of certain non-routine disclosures of their PHI made by the entity.
Restrictions & Confidential Communications: Patients may ask providers to restrict certain uses or disclosures of their PHI (though providers aren’t always required to agree). They can also request communications through alternative means or locations for more privacy (e.g. using a personal email or mailing address).
Right to Complain: Individuals can file a complaint if they believe their privacy rights were violated – either with the healthcare provider or directly with HHS’s Office for Civil Rights (OCR), which enforces HIPAA.
These rights put patients in control of their information, aligning with HIPAA’s goal of fostering trust in the healthcare system. Empowered patients who know their data is protected are more likely to share important health details, leading to better care outcomes.
Limits on Use and Disclosure of PHI
The Privacy Rule sharply limits when PHI can be used or disclosed without the patient’s explicit permission. In general, covered entities are only allowed to use/disclose PHI for “TPO – Treatment, Payment, or Healthcare Operations” (such as sharing info between treating doctors, billing insurance, or internal quality reviews) and for a few other permitted purposes. Outside of these situations, the patient’s written authorization is required.
Even when sharing PHI for permitted purposes, the “Minimum Necessary” standard applies. This means staff should access or disclose only the minimum amount of information needed to accomplish the task. For example, a billing clerk might need a patient’s contact and billing code, but not their full medical history. By default, any use or disclosure should be on a strict need-to-know basis to protect patient privacy.
Other important Privacy Rule limits and requirements include:
Incidental Disclosures: Accidental or secondary disclosures (like someone overhearing a patient’s name in a waiting room) aren’t considered HIPAA violations as long as reasonable safeguards are in place. However, intentional or careless sharing beyond what’s permitted is not allowed.
Authorization for Marketing & Fundraising: Using PHI for marketing purposes, selling data, or certain fundraising communications generally requires patient authorization. Covered entities must be careful with communications that could be considered marketing under HIPAA.
Special Cases: The rule carves out specific allowable disclosures for public interest purposes – for example, reporting certain communicable diseases to public health authorities, or to law enforcement in limited scenarios. These are the national priority purposes (like public health, abuse reporting, court orders, etc.), where PHI may be shared without consent as explicitly allowed by HIPAA. Even then, only relevant information should be disclosed.
In summary, **the Privacy Rule aims to ensure PHI is used only as necessary for patient care and other important purposes, and never freely shared without consent. By limiting disclosures and requiring patient consent for non-routine uses, HIPAA guards against unauthorized exposure of sensitive health details.
The HIPAA Security Rule
While the Privacy Rule governs who can access PHI and under what conditions, the HIPAA Security Rule focuses on how health information is protected, especially in electronic form. It establishes national standards for safeguarding electronic PHI (ePHI) – any identifiable health data created, stored, or transmitted electronically. The Security Rule complements the Privacy Rule by ensuring that once you know who should see data, you also have proper defenses so that no one else can access it.
Under the Security Rule, covered entities and business associates must implement a series of administrative, physical, and technical safeguards to protect the confidentiality, integrity, and availability of ePHI. These safeguards are designed to be flexible and scalable – a small clinic’s implementation will look different from a large hospital’s – but reasonable and appropriate protections must be in place for all. Below we break down the three categories of safeguards with examples:
Administrative Safeguards
Administrative safeguards are policies, procedures, and organizational measures to manage the security of ePHI. Essentially, it’s the human and process side of data protection. Key administrative safeguards include:
Security Management Process: Conduct regular risk analyses to identify potential vulnerabilities to ePHI, and implement risk management plans to address those gaps. For example, a clinic should assess risks like outdated antivirus software or weak passwords and then mitigate them.
Assigned Security Responsibility: Designate a security officer to develop and enforce security policies. This person (or team) oversees HIPAA compliance efforts.
Workforce Security: Ensure only authorized staff can access ePHI relevant to their role, and that access is promptly revoked when an employee leaves or changes roles. This includes clearance procedures and supervision of those handling sensitive data.
Security Awareness Training: Provide regular training and education to all workforce members on security policies and safe practices. Employees are often the weakest link, so ongoing training (e.g. on recognizing phishing emails, proper password management, social media precautions, etc.) is critical. For instance, staff should be taught not to leave charts open on screens or discuss patient info in public areas.
Incident Response Plan: Establish procedures to identify and respond to security incidents (like a malware infection or unauthorized access), mitigate harm, and document the incident and outcome. This may involve an incident response team and a clear breach notification process.
Contingency Plan: Prepare for emergencies (Cyberattacks, power outages, natural disasters) by having data backup and disaster recovery plans. For example, regularly back up databases off-site and have a plan to restore critical systems so patient care can continue if systems go down.
Evaluation: Periodically evaluate the effectiveness of security measures and procedures. Technology and threats evolve, so you should reassess your safeguards (e.g. annually or when major changes occur) to ensure continued compliance.
Business Associate Agreements (BAAs): Sign contracts with any third-party partners (billing companies, cloud providers, etc.) who handle PHI, requiring them to follow HIPAA security standards. A BAA legally binds vendors to protect ePHI and report breaches. Never send ePHI to a vendor without a signed agreement in place.
These administrative steps form the foundation of a HIPAA compliance program – they set the expectations and processes that technical and physical measures will support.
Physical Safeguards
Physical safeguards involve controlling physical access to systems and facilities to protect ePHI. In practice, this means securing the buildings, computers, and devices where PHI is stored or used. Important physical safeguards include:
Facility Access Controls: Limit access to buildings or areas where sensitive health IT systems reside. For example, server rooms or record storage areas should be locked and only accessible to authorized personnel (using keys, badges, or security codes). Many healthcare providers use ID badge systems or even biometric locks for high-security areas.
Workstation Security: Establish rules for how workstations (computers, terminals) that access ePHI are positioned and protected. This can include privacy screen filters, automatic log-off or screen locking after inactivity, and ensuring screens aren’t visible to the public. Also, staff should not leave logged-in computers unattended in exam rooms or nurses’ stations.
Device and Media Controls: Manage the receipt and removal of hardware and electronic media that contain ePHI. This means tracking where servers, laptops, USB drives, backups, etc. are at all times and how they are disposed of. Proper disposal is crucial – PHI should be wiped or shredded before devices or papers are discarded. Lost or stolen devices (like an unencrypted laptop or smartphone) are a common cause of breaches, so policies should address encryption (see below) and physical device security (e.g. not leaving laptops in a car trunk overnight).
Additionally, physical safeguards cover things like visitor sign-in logs, security cameras in record storage areas, and policies against unauthorized people accessing computers. Even something as simple as having a clean desk policy (no patient files left out) and locking file cabinets falls under protecting PHI physically.
Technical Safeguards
Technical safeguards are the technology and related policies that protect ePHI within information systems. They are what people typically think of as “IT security.” Key technical safeguards mandated by HIPAA include:
Access Controls: Implement technical measures that allow only authorized individuals to access ePHI. Each user should have a unique user ID and authentication (e.g. password, PIN, biometric) to access systems. Use role-based access to ensure users only see the minimum necessary info for their role. Also consider multi-factor authentication for remote or high-risk access to add an extra layer of security.
Audit Controls: Use hardware or software to record and examine activity in systems that contain PHI. Audit logs should track user logins, file access, edits, and other actions. Regularly review these logs to spot suspicious activity (like a user accessing an unusual number of records). This helps detect internal misuse or external intrusions.
Integrity Controls: Protect ePHI from being altered or destroyed in an unauthorized way. Mechanisms like checksums, data backup and checks, or blockchain-style audit trails can ensure that if a record is tampered with, it’s detected. For instance, ensure that transmitted data isn’t modified in transit and that your EHR system has integrity verification.
Person/Entity Authentication: Verify that any person or entity seeking access to ePHI is who they claim to be. This goes beyond just passwords – it can include using digital certificates or secure tokens to authenticate devices, and policies like not sharing login credentials. In practice, strong passwords and multi-factor auth enforce this.
Transmission Security: Safeguard ePHI when it’s transmitted over networks. This typically means encryption of data in transit (e.g. using HTTPS for web portals, SSL/TLS for email or VPNs for remote access) so that if data is intercepted, it’s unreadable. It also involves protecting against network threats – e.g. using firewalls and secure communication protocols to prevent eavesdropping or man-in-the-middle attacks.
Encryption deserves special mention: While HIPAA deems encryption an “addressable” implementation (meaning you must evaluate if it’s appropriate), it’s effectively a best practice. Encrypting PHI both at rest (on servers, databases, laptops) and in transit can protect data even if devices are lost or communications are intercepted. For example, an encrypted laptop’s data remains safe even if stolen, and encrypted emails ensure only intended recipients can read the content. Many recent enforcement actions specifically called out failure to encrypt portable devices as a violation.
In sum, the Security Rule expects healthcare organizations to take a comprehensive, multilayered approach to cyber defense. From strong passwords and access controls to alarmed server rooms and continuous employee training, all these safeguards work together to keep patient data safe from both digital and physical threats. HIPAA also recognizes one size doesn’t fit all – what’s required is that you assess your own risk environment and implement “reasonable and appropriate” measures for your situation. Small practices might use off-the-shelf secure software and basic policies, whereas large hospitals invest in sophisticated monitoring, but both must meet the standard of due diligence in protecting ePHI.
HIPAA Violations & Penalties
Despite best efforts, violations of HIPAA still occur frequently – and regulators are serious about enforcement. Failure to comply with HIPAA can result in severe penalties, including civil fines and even criminal charges for egregious misconduct. The HHS Office for Civil Rights (OCR) is the primary enforcer, conducting investigations and audits, and state Attorneys General can also take action. For healthcare organizations, a HIPAA violation not only means potential fines but also reputational damage, costly remediation, and loss of patient trust.
HIPAA penalty structure: Civil penalties are tiered based on the level of negligence:
Tier 1 (Unknowing): For violations where the entity was unaware and could not have reasonably avoided the breach – fines around $100–$1,000 per violation.
Tier 2 (Reasonable Cause): For violations due to reasonable cause and not willful neglect – fines around $1,000–$50,000 per violation.
Tier 3 (Willful Neglect, Corrected): For willful neglect violations corrected in 30 days – fines $10,000–$50,000 per violation.
Tier 4 (Willful Neglect, Not Corrected): For willful neglect not corrected promptly – fines $50,000+ per violation, up to a cap (originally $1.5 million per year for repeats, adjusted for inflation to ~$2.1 million as of 2024).
These fines add up quickly – for instance, a single breach exposing many records can count as multiple violations. In 2024, the most serious HIPAA offenses saw penalties reaching multi-millions; one notable state-level action resulted in a $6.75 million fine after a vendor’s massive data breach. Additionally, the Department of Justice can pursue criminal charges for HIPAA violations that involve deliberate misuse of PHI. Criminal penalties can include fines up to $250,000 and imprisonment up to 10 years for offenses committed with malicious intent (such as selling patient data).
Beyond government action, violations often require patient notification, credit monitoring for victims, and internal fixes – all of which are costly. Clearly, the stakes for non-compliance are high. Let’s look at common mistakes that lead to violations and some real-world enforcement examples.
Common HIPAA Violations to Avoid
Understanding common HIPAA mistakes can help your organization steer clear of trouble. According to compliance experts, the most frequent HIPAA violations that result in penalties include:
Employee Snooping: Unauthorized staff access to patient records out of curiosity or for personal reasons. For example, workers looking up family, neighbors, or celebrity medical files without a job-related reason.
Lack of Risk Analysis: Failing to conduct regular, enterprise-wide security risk assessments. Without identifying vulnerabilities (like outdated software or open ports), organizations can’t address them – a clear HIPAA violation.
Poor Risk Management: Even if risks are identified, not taking action (no risk management plan, or ignoring known security holes) is a violation. HIPAA fines often cite “failure to manage identified risks” as a serious offense.
Denied or Delayed Patient Access: Ignoring a patient’s request for their medical records or taking too long (beyond 30 days) to provide them. OCR’s Right of Access Initiative has fined many providers for this seemingly simple requirement.
No Business Associate Agreement (BAA): Sharing PHI with a vendor or partner without a proper BAA in place. This is a common oversight – e.g. using a cloud service or translator without a signed agreement – and has led to penalties.
Inadequate Access Controls: Not using unique logins or not limiting user privileges. If multiple employees share one login or if former staff still have access, that’s a violation waiting to happen.
Lack of Encryption: Storing ePHI on unencrypted devices (laptops, USB drives, etc.) or sending PHI via unencrypted email. Loss or theft of such devices has resulted in large fines when data wasn’t encrypted.
Late Breach Notifications: Exceeding the 60-day deadline to notify affected individuals and HHS after discovering a data breach. Timely breach reporting is required by the HIPAA Breach Notification Rule.
Impermissible Disclosures: Any release of PHI not permitted by the Privacy Rule – for example, a clinic improperly sharing patient info on social media or a staff member discussing a patient with a friend. Even seemingly small gossip can be a breach if it involves identifiable health info.
Improper Disposal: Throwing paper records or devices containing PHI in the trash without shredding or wiping. Dumpsters have been a source of ePHI exposure due to carelessness in disposal.
Each of the above has real-case examples behind it. Most HIPAA settlements involve multiple failures. The bottom line: ensure your organization addresses these common areas – through strict policies, training, and audits – to avoid being the next cautionary tale.
Real-World Enforcement Actions
To truly understand the consequences of non-compliance, consider a few real-world HIPAA enforcement cases from recent years:
Insider Snooping Leads to Fines: Yakima Valley Memorial Hospital learned the hard way that employee curiosity can be costly. An investigation found that 23 security guards had used their login credentials to peek at thousands of patient records without a valid reason. Because the hospital lacked adequate access controls and monitoring, it was deemed a HIPAA violation and resulted in a fine. This case highlights the need for policies restricting record access and regular audit log reviews to catch and deter snooping.
Revealing PHI in Social Media/Reviews: In another case, a mental health practice (Manasa Health Center) received a patient’s negative online review and made a critical error – a staff member responded publicly, disclosing the patient’s PHI in the reply. This impermissible disclosure violated the Privacy Rule and led to a fine and mandated corrective action. Healthcare providers must resist the urge to rebut or disclose any patient details in public forums. HIPAA covers social media and online activity too – patient privacy must be maintained both offline and online.
Large-Scale Cybersecurity Failures: On the larger end, major breaches have drawn multi-million dollar penalties. For example, a technology provider, Blackbaud, Inc., suffered a ransomware attack in 2020 that affected numerous healthcare clients. They reached a settlement of $6.75 million in one state (California) in 2024 for their role in exposing patient data, on top of a broader multi-state settlement. Regulators cited the need for better vendor oversight, strong encryption, and prompt breach notification. This case underscores that business associates are directly liable for HIPAA compliance and that one breach can implicate many covered entities if a common vendor is at fault.
There are many similar stories: a dental office fined $50k for leaving patient files in an unsecured dumpster, a hospital system paying $2.2M after a stolen mobile device wasn’t encrypted, a clinic fined for mailing records to the wrong patient, and so on. OCR’s enforcement database shows over 150 cases since 2008 resulting in financial settlements, totaling more than $144 million in fines. State Attorney Generals have also issued penalties (sometimes teaming up across states for larger settlements).
The clear message from enforcement trends is that HIPAA compliance cannot be taken lightly. Regulators are increasingly aggressive, especially with rising cyber threats. In fact, 2024 and 2025 saw record-breaking fines, and officials warn that penalties may further increase to drive compliance. For healthcare organizations, the cost of implementing robust privacy and security measures is minuscule compared to the financial and reputational damage of a breach. Compliance is not just about avoiding fines either – it’s about protecting your patients and the integrity of your practice.
Best Practices for HIPAA Compliance
Achieving HIPAA compliance is an ongoing process that blends people, process, and technology. By following best practices, healthcare organizations can greatly reduce the risk of violations and ensure patient information stays safe. Below are essential strategies and best practices for maintaining compliance:
Training & Education
Regular staff training is one of the most effective tools to prevent HIPAA issues. Employees should clearly understand what HIPAA requires and how it applies to their job role, because human error is often the weakest link in security. Best practices for training and fostering a privacy-conscious culture include:
Annual and Ongoing Training: Don’t settle for a once-a-year checkbox video. Provide engaging HIPAA training at hire and refresher sessions throughout the year. Short, frequent trainings (e.g. monthly 20-minute workshops) on specific topics can keep awareness high. Topics might include social engineering and phishing, proper email use, social media dos and don’ts, how to report incidents, etc.
Tailor to Roles: Make training relevant to each department’s responsibilities. Clinical staff might need extra focus on patient privacy scenarios, while IT staff need deeper security protocol training. Use real-world examples (like the cases mentioned above) to illustrate points.
Emphasize Privacy & Security Habits: Encourage simple but crucial habits: strong passwords, locking screens, verifying identities before releasing info, not discussing patients in public areas, double-checking email recipients, etc. Repetition of these habits in training helps them stick.
Test and Remind: Periodically test employees with simulated phishing emails or quizzes to gauge retention. Send out security tips via newsletters or posters in break rooms to keep HIPAA top-of-mind. Making compliance part of everyday conversation fosters a culture where employees take ownership of protecting PHI.
Enforce Consequences: Pair training with clear sanction policies. Staff should know that carelessness or willful violations (like snooping) could lead to disciplinary action. When employees see that management takes HIPAA seriously, they will too. Conversely, acknowledge and reward departments with exemplary compliance records to reinforce positive behavior.
Remember, an educated workforce is your first line of defense. Many breaches (lost laptops, mis-mailed documents, etc.) are honest mistakes that proper training and vigilance can prevent. By building a privacy-aware culture, you greatly reduce the likelihood of violations.
Technology Solutions for Security
Leveraging the right technology is vital for HIPAA compliance in today’s digital health environment. While HIPAA is technology-neutral (it doesn’t mandate specific products), there are many technology solutions and safeguards that can strengthen your security posture:
Encryption Everywhere: As noted earlier, use robust encryption for PHI at rest and in transit. Modern EHR systems and messaging platforms often have built-in encryption – ensure it’s enabled. For email, consider a secure messaging portal or an email encryption service for sending PHI to patients or other providers. Encryption renders data unreadable to unauthorized parties, which can save you in the event of device theft or hacking.
Access Control and Identity Management: Implement centralized access management so that you can easily add/remove user access and enforce least privilege. This might involve an EMR/EHR system with role-based permissions, active directory groups for network access, and multi-factor authentication especially for remote or admin access. Also, deploy automatic logoff or session timeouts to prevent open sessions from being misused.
Audit and Monitoring Tools: Take advantage of audit log tools that track user activity in your systems. Even better, use automated monitoring solutions that flag unusual access patterns (e.g. an employee viewing an abnormally large number of records). Some advanced systems use AI to detect anomalous behavior that could indicate snooping or a hacked account. Timely alerts allow you to respond to potential breaches before they escalate.
Secure Communication Tools: Standard texting or consumer apps aren’t appropriate for sharing PHI. Use HIPAA-compliant communication tools – secure messaging apps, telehealth platforms, and patient portals that meet encryption and authentication standards. For example, many practices use secure texting apps for clinicians which encrypt messages and can be remotely wiped if a phone is lost.
Up-to-date Infrastructure: Keep all systems and software updated with security patches. Many breaches exploit known vulnerabilities in outdated software. Regularly update your EHR, server OS, firewalls, and anti-malware tools. If you don’t have in-house IT, consider managed services to ensure updates and monitoring are continuous.
Data Backup and Recovery Solutions: Use reliable backup solutions for all critical data, stored in a secure, off-site or cloud location. Periodically test restoring backups to ensure your contingency plans work. In a ransomware attack, having clean backups can be a savior (and avoid having to pay an attacker or lose data).
Device Management: Use mobile device management (MDM) software if staff use smartphones or tablets for work. MDM can enforce encryption and remotely wipe a lost device. Likewise, ensure all laptops have full-disk encryption and consider disabling USB ports or using DLP (data loss prevention) software to control copying of data.
Firewall and Network Security: Maintain strong network defenses – firewalls, intrusion detection/prevention systems (IDS/IPS), and possibly VPN requirements for remote access. Segment your network so that sensitive systems are isolated and not all devices see all data. For example, guest Wi-Fi should be separate from the internal network.
Evaluate Cloud Services Carefully: If using cloud EHRs or any cloud storage, ensure the provider signs a BAA and offers robust security. Many cloud services can be very secure (often more than in-house servers), but you must configure them correctly (for instance, not leaving cloud storage buckets open to the public, a mistake some organizations have made).
By investing in these technology solutions, healthcare organizations can not only meet HIPAA requirements but often streamline their operations. For instance, a secure patient portal that lets patients message their provider or download records can improve service while staying compliant. Technology is an enabler of both better healthcare and better security – the key is to implement it thoughtfully and keep it maintained.
Finally, pairing technology with regular internal audits is wise. Conduct your own compliance audits or hire external experts to find any weaknesses before OCR does. This can include penetration testing of your network, reviewing user access logs, and checking that all HIPAA policies are being followed in practice. Think of it as a “preventive check-up” for your organization’s health data security.
Conclusion: Prioritize Privacy, Protect Your Patients
Staying compliant with HIPAA is not just a legal obligation – it’s fundamental to delivering quality, trustworthy healthcare in the digital age. Patients trust you with their most sensitive information, and meeting HIPAA’s privacy and security standards is how you honor that trust. We’ve explained how HIPAA’s Privacy Rule gives patients control over their data and how the Security Rule demands rigorous safeguards to keep that data safe. We’ve also seen how costly the consequences of neglect can be, and outlined proactive steps to avoid that fate.
Now it’s up to your organization to put these principles into action. Make HIPAA compliance a daily commitment: cultivate an educated workforce that values patient confidentiality, implement robust technical protections against breaches, and continuously monitor and improve your safeguards. The investment you make in compliance today pales in comparison to the financial and reputational hit of a major violation or breach.
Call to Action: Don’t wait for a breach or audit to test your HIPAA compliance. Start strengthening your privacy and security measures now. Review your policies, train (and re-train) your staff, update your technology, and engage experts if needed to audit your setup. By taking these actions, you not only avoid penalties but also create a safer environment for patient care. In a healthcare world increasingly driven by data, being a champion of patient privacy and data security will set you apart. Protect your patients, protect your organization – make HIPAA compliance part of your organization’s DNA starting today.
Frequently Asked Questions (FAQs)
What does HIPAA stand for?
HIPAA stands for the Health Insurance Portability and Accountability Act of 1996. This U.S. law has multiple provisions, but it’s best known for establishing rules to protect health insurance coverage when people change or lose jobs (portability) and for setting national standards for healthcare data privacy and security. When people refer to “HIPAA compliance,” they usually mean adhering to the HIPAA Privacy Rule, Security Rule, and related regulations that safeguard patient health information.
Who must comply with HIPAA?
HIPAA’s rules apply to “covered entities” and their “business associates.” Covered entities include healthcare providers (doctors, clinics, hospitals, pharmacies, dentists, etc.) that transmit health information electronically, health plans (insurance companies, HMOs, employer health plans, Medicare/Medicaid), and healthcare clearinghouses. If you fall into one of these categories, you must comply. Business associates are vendors or contractors who handle protected health information on behalf of a covered entity – for example, billing companies, IT providers, cloud services, transcription services, etc. They are also required to comply with HIPAA security standards and certain privacy provisions. Essentially, if your work involves using or disclosing patients’ identifiable health information in a healthcare context, HIPAA compliance is required. It’s worth noting that employees of a covered entity (like nurses, receptionists, etc.) aren’t directly “covered” by HIPAA as individuals, but through their employer they must follow HIPAA rules (and can face consequences for violations).
What are the penalties for HIPAA violations?
Penalties for HIPAA violations can be severe, ranging from civil fines to criminal charges depending on the offense. Civil penalties are tiered by the level of negligence. For unintentional violations (Tier 1), fines might be on the order of $100–$1,000 per violation (with annual caps in the tens of thousands), whereas willful neglect that is not corrected (Tier 4) carries fines of $50,000 or more per violation, with annual caps around $1.5 million (adjusted upward for inflation). These fines add up – a single data breach incident can involve many violations. For example, failing to secure a system that leads to 1,000 patient records exposed could theoretically multiply the fines. Criminal penalties apply if someone knowingly misuses PHI. These can include fines up to $50,000 and 1 year in jail for basic offenses, up to $100,000 and 5 years in jail for offenses under false pretenses, and up to $250,000 and 10 years in prison if someone illicitly uses PHI for personal gain or malicious harm. Aside from government fines, violators may face lawsuits under state laws, corrective action plans, and significant costs for breach mitigation and notification. In short, HIPAA penalties can be financially devastating – it’s far better (and usually much cheaper) to invest in compliance and prevent violations upfront.
How do healthcare providers stay HIPAA compliant?
Staying HIPAA compliant requires a combination of good policies, continuous training, and the right technology in your practice. First, providers should develop clear privacy and security policies aligned with HIPAA – covering things like who can access records, how to respond to patient requests, how to handle emails, breach response steps, etc. Then, train your staff regularly on these policies and HIPAA guidelines so everyone understands their role in protecting patient information. Assign a privacy or security officer to oversee compliance efforts. Perform regular risk assessments to identify any vulnerabilities in how you handle patient data (for example, unencrypted devices, weak passwords, unlocked file cabinets) and take steps to fix them – this could include upgrading IT systems, enabling encryption, using secure messaging for communication, and enhancing physical security in records areas. Always sign Business Associate Agreements with any vendor touching PHI. Keep patient data on a need-to-know basis and use the “minimum necessary” rule for disclosures. It’s also wise to conduct internal audits – simulate what an OCR audit might check – to ensure you’re consistently following HIPAA rules in practice. Essentially, make privacy and security part of your daily operations: verify identities before releasing info, promptly update or remove access when staff roles change, maintain up-to-date antivirus and software patches, and so on. By building a strong compliance program and culture, healthcare providers can confidently meet HIPAA requirements while focusing on patient care. Remember, HIPAA compliance isn’t a one-time project but an ongoing commitment to doing things right with patient data.